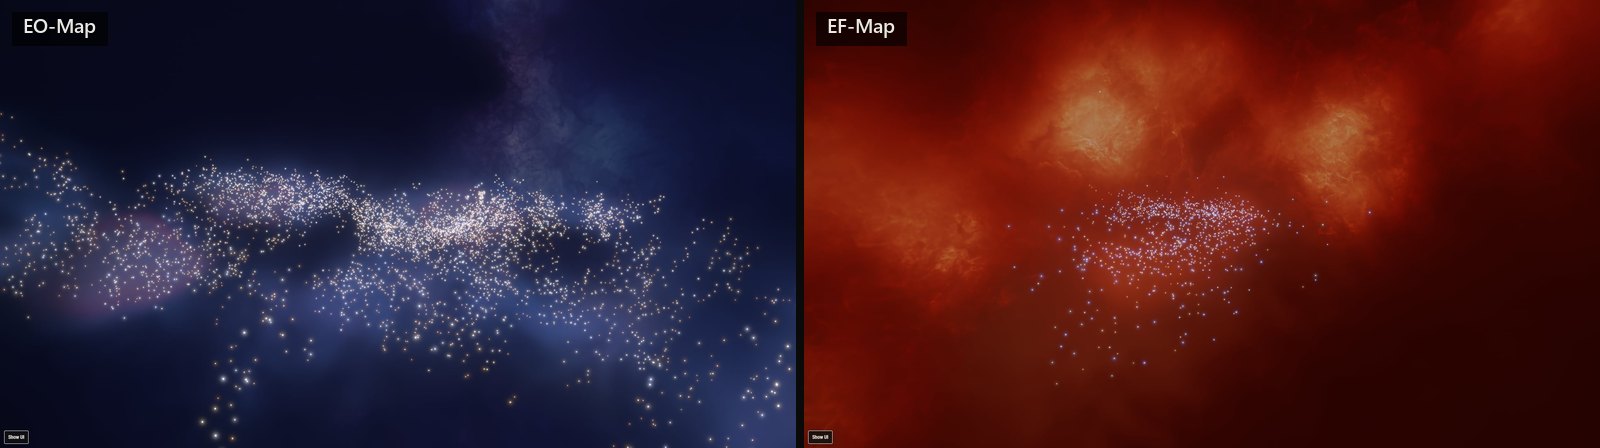
EO-Map is three months old this week, so I've been looking at its Google numbers next to the same numbers from my first map, EF-Map, which I built for EVE Frontier. The timing turns out to be almost exact. The first commit in EF-Map's repository is dated 12 August 2025, and I forked it to start EO-Map on 12 August 2026, which I wrote about in how EO-Map came about. So I've got two maps built by the same person, measured over the same three months of the year, a year apart.
They're not the same kind of site and they're not in the same market, so this isn't a scoreboard. But putting them side by side showed me a couple of things I didn't expect, and one of them is probably the most useful thing I've learned about running a site like this.
EF-Map was my first website
When I started EF-Map I'd never built a website before. I'm not a coder, I build everything with AI agents, and I knew nothing about SEO or Google Analytics. My focus was getting the map working and then adding features as fast as people asked for them. How Google was going to find it didn't really cross my mind.
For about the first six weeks it was a single page. No landing pages, no FAQ, nothing for a search engine to read apart from the app itself. Search Console says EF-Map first turned up in a Google result on 18 August 2025, and in its first 28 days it got 52 impressions and 5 clicks. The first proper SEO work went in on 24 September. A FAQ, a features page, an about page, a sitemap and a robots file. Basic stuff, the kind of thing I'd now do before launching anything. Google Analytics didn't go on until 3 November, almost twelve weeks in, the same day I put the first batch of blog posts up. The llms.txt file and the AI facts page, the bits aimed at AI assistants, didn't arrive until February.
So EF-Map's first few months have Google search data but no Google Analytics. It did have its own simple usage counters from the end of August, so I know it had users before November, but nothing I can line up against GA4.
EO-Map started with all of that
By the time I built EO-Map I'd been through it once. It launched on 18 August 2026 with its title, description, canonical address, social preview tags, structured data, sitemap and robots file already done. Two days later it had fifteen landing pages for the main tools and an llms.txt, and Google Analytics went on the day after that. The blog came back about a fortnight later, and the weekly State of New Eden reports started about a month after launch.
None of that is clever. It's just everything I'd learned the hard way on EF-Map, done at the start instead of months in. I also pushed EO-Map quite hard on Reddit early on, which I'll come back to.
What Google saw
Search Console counts two main things. An impression is your site appearing in someone's search results, whether they noticed it or not. A click is them actually clicking on it. Here's each map's first three months.
| Google Search | EF-Map, 2025 | EO-Map, 2026 |
|---|---|---|
| Days measured | 91 | 89 |
| Impressions | 1,712 | 4,885 |
| Clicks | 286 | 381 |
| Click-through rate | 16.7% | 7.8% |
| First 28 days, impressions | 52 | 563 |
| First 28 days, clicks | 5 | 64 |
| Last 28 days, impressions | 1,157 | 2,713 |
| Last 28 days, clicks | 185 | 187 |
EF-Map's period is 18 August to 16 November 2025 and EO-Map's is 19 August to 15 November 2026, so they cover the same weeks of the year. On the totals EO-Map got about 2.85 times the impressions and a third more clicks. The difference at the start is much bigger than that, 64 clicks in the first four weeks against 5. I think some of that is the groundwork being there from day one, but I'd be kidding myself if I said it was all of it. Far more people search for EVE Online things than for EVE Frontier things, so there was a lot more for Google to show EO-Map for.
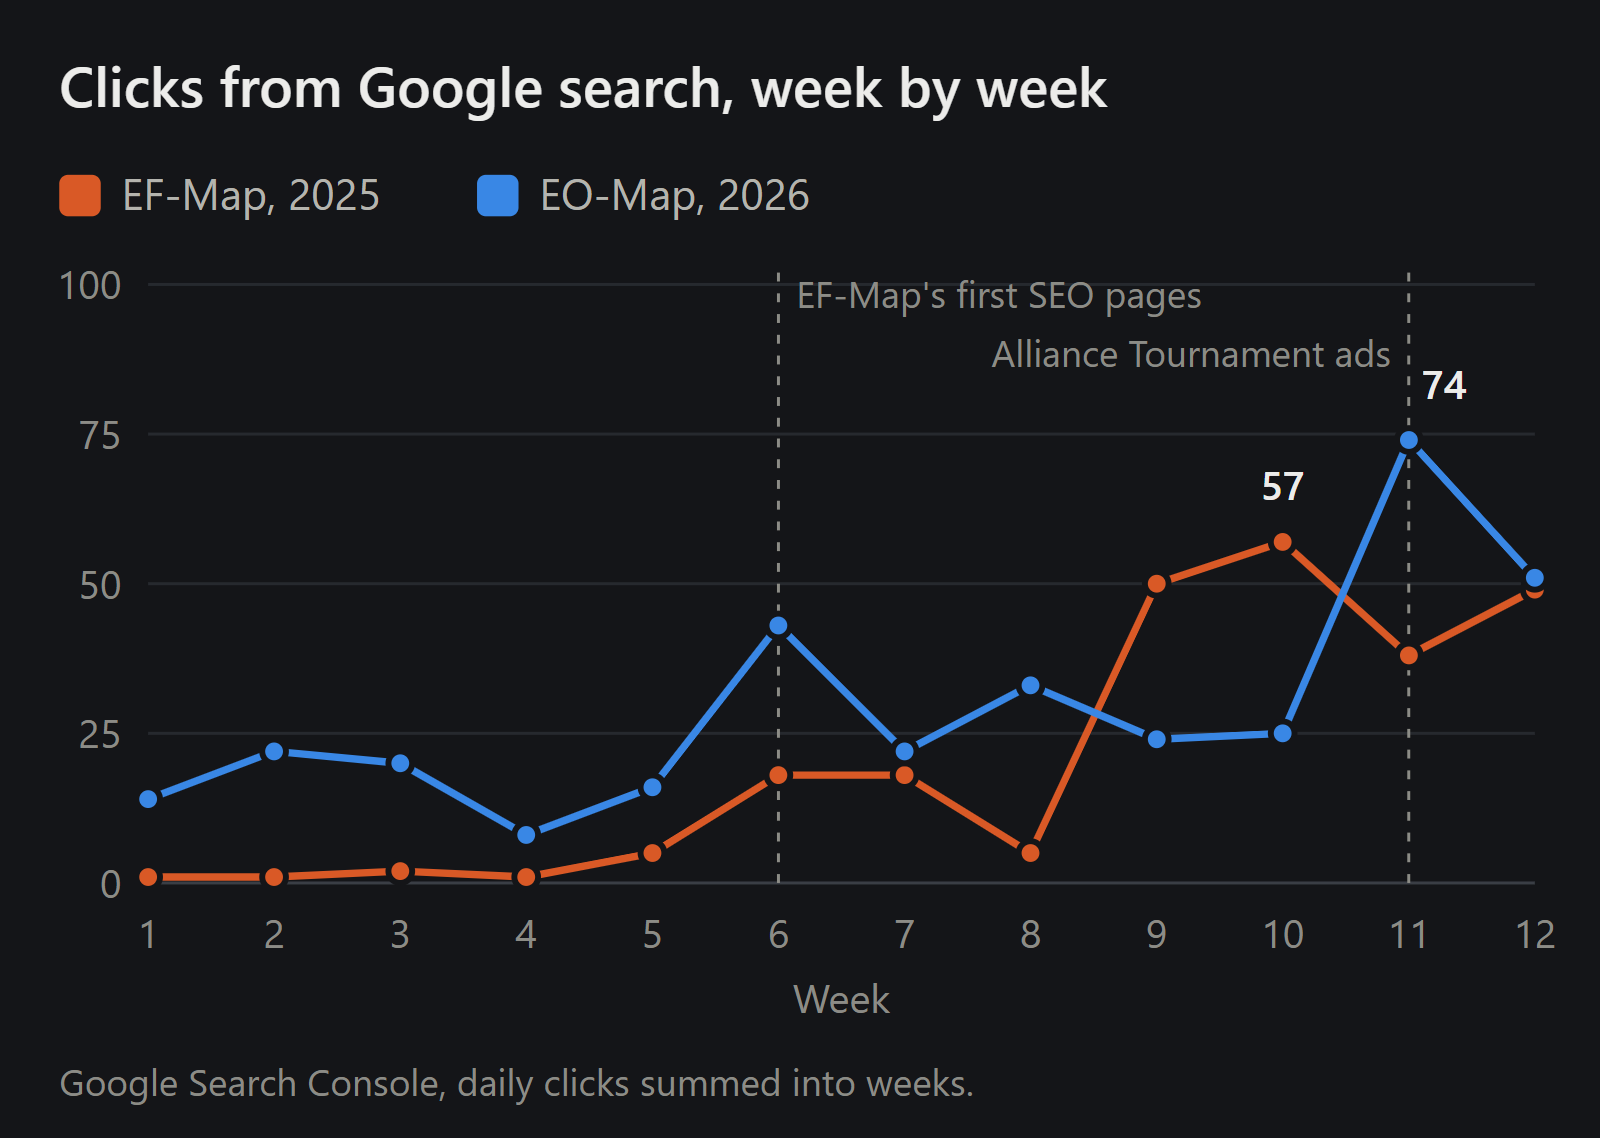
You can see EF-Map wake up in week 6, the week those first SEO pages went in, going from 5 clicks to 18. I can't prove one caused the other, but it's the first time the line moves. EO-Map's best week is week 11, which was the Alliance Tournament XXII finals weekend on 31 October and 1 November. I had adverts running during the broadcast. They didn't bring a big rush of visitors, daily users went from the high 40s to the low 80s for a few days, but the 31st was EO-Map's best day for Google clicks so far. My guess is people saw the advert and searched for it rather than typing the address in.
The bit I find most interesting is the end, though. In the last 28 days of each period EF-Map got 185 clicks and EO-Map got 187. Practically identical. EO-Map needed 2,713 impressions to get there, and EF-Map needed 1,157.
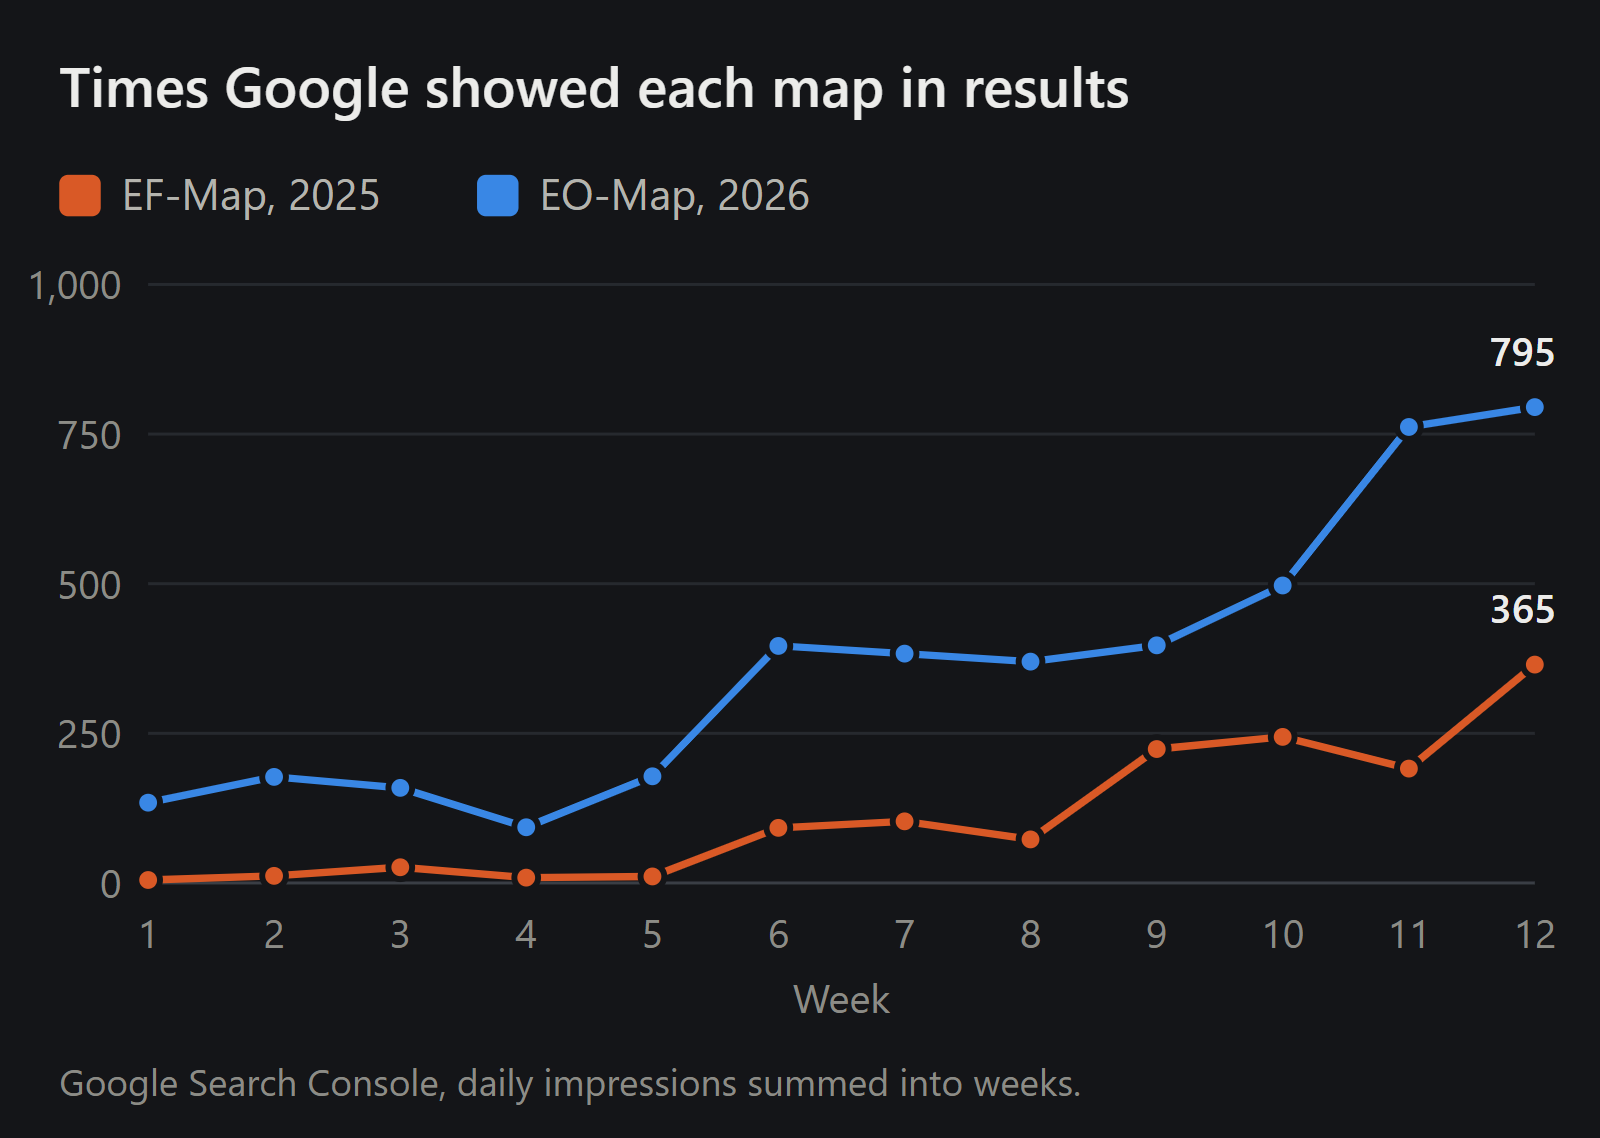
That's what the click-through rate is telling you. EF-Map's was 16.7% and EO-Map's is 7.8%. My guess is that when EF-Map showed up in a search, it was usually because somebody was looking for an EVE Frontier map, and there were only a couple of map or routing tools to choose from, so it got clicked. EVE Online has been around for 23 years and has map tools people have used for most of that time. EO-Map shows up in plenty of searches, but often further down the page, below sites people already know, and I think most people just click the one they know. So more impressions isn't automatically better. It means Google is willing to show you to more people, not that they'll click.
Same age, nearly the same audience
The Google Analytics numbers are harder to compare, because the two three-month windows I've got aren't the same stage of each site's life. EF-Map's analytics only start on 3 November 2025, so its first three months of data cover roughly its third to sixth months. EO-Map's run from launch to month three.
There is one window that lines up exactly though. EF-Map's first two weeks of analytics, 3 to 16 November 2025, were days 83 to 96 after its first commit. The same dates this year are days 83 to 96 for EO-Map too. So I pulled that fortnight for both.
| 3 to 16 November | EF-Map, 2025 | EO-Map, 2026 |
|---|---|---|
| Users | 571 | 538 |
| Returning users | 240 | 219 |
| Users who first came from Google search | 99 | 101 |
| Sessions | 2,583 | 1,362 |
| Average engagement time per active user | 8m 30s | 4m 40s |
| Engaged sessions per active user | 2.32 | 1.78 |
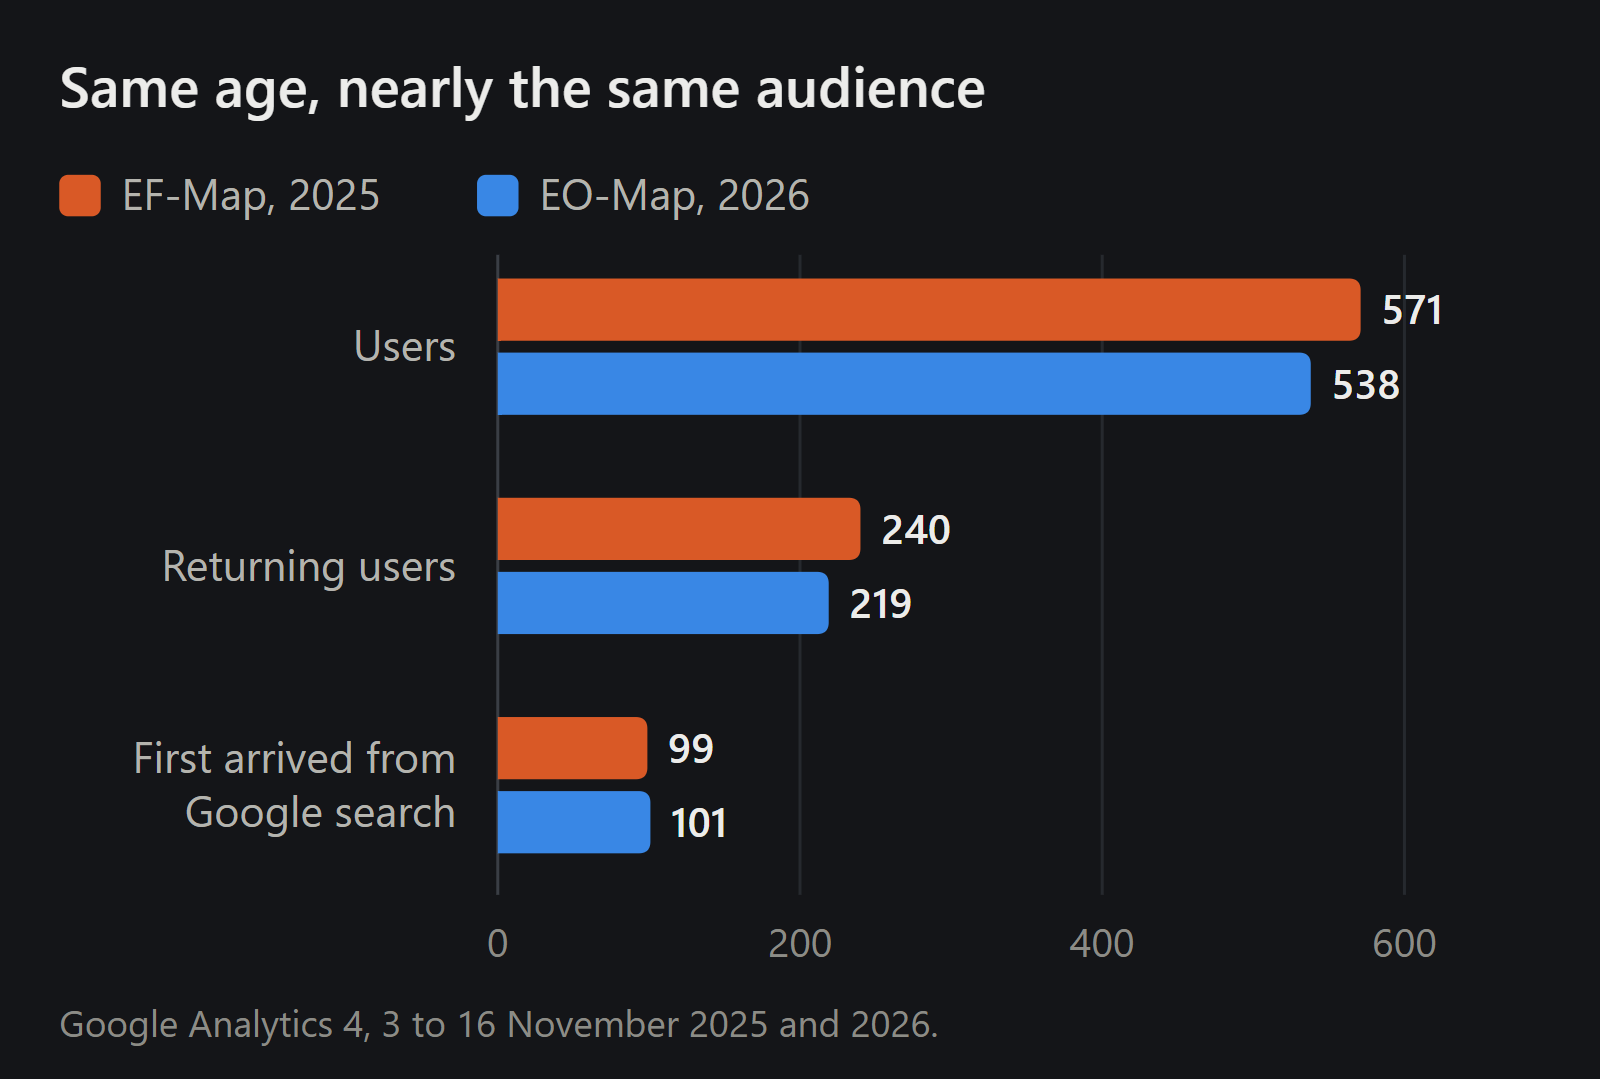
I didn't expect that. At the same age the two maps had almost the same number of users, almost the same number of returning users, and almost exactly the same number of people who first arrived from a Google search, 99 against 101. If anything it flatters EO-Map, because GA4 had only been on EF-Map for two weeks. It treated every regular as brand new the first time it saw them, and put them down to whatever brought them in that day, so EF-Map's real returning figure would have been higher and its Google figure is a bit muddied too.
So by about three months both maps were bringing in about the same number of people. Where they're completely different is what those people did once they got there.
Where they split
EF-Map's users averaged 8m 30s of engagement in that fortnight and EO-Map's averaged 4m 40s. EF-Map's 571 users had 2,583 sessions between them, and EO-Map's 538 had 1,362. Nearly all of the gap is in the regulars. Somebody coming back to EF-Map in those two weeks came back about 8 times and spent 16m 38s on those return visits in total. On EO-Map it was about 4 times and 6m 07s. First visits went the other way. People actually spent longer on their first look at EO-Map, about two and a half minutes against one and a half, although I wouldn't lean on that too much because of the same GA4 problem.
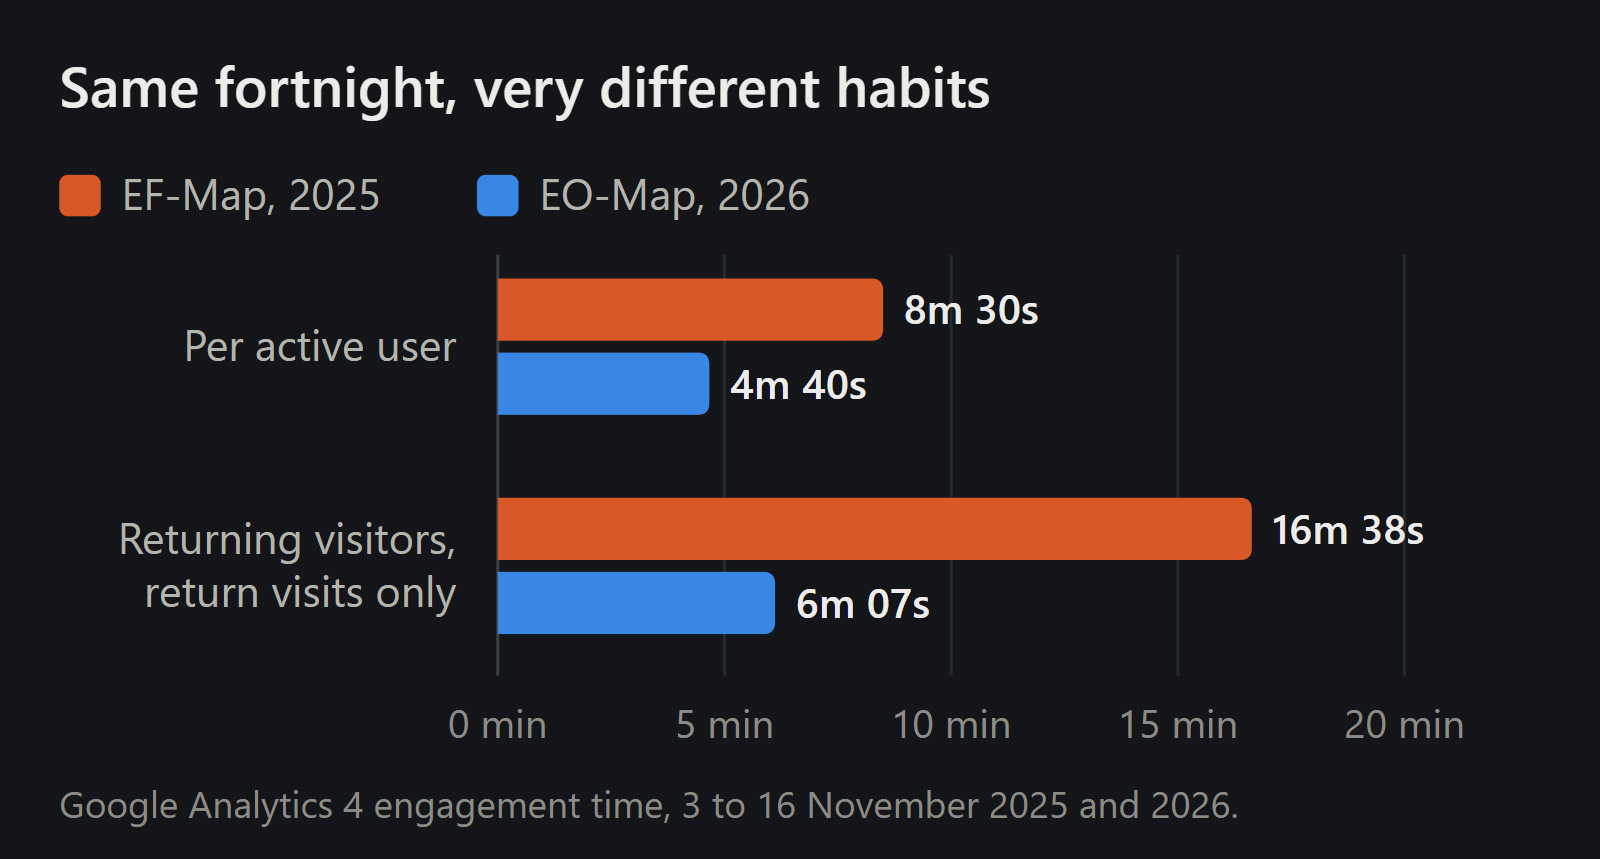
Over the full three months the pattern is the same, just bigger.
| Google Analytics, three months each | EF-Map | EO-Map |
|---|---|---|
| Dates | 3 Nov 2025 to 1 Feb 2026 | 21 Aug to 15 Nov 2026 |
| Stage | months 3 to 6 | launch to month 3 |
| Users | 3,392 | 3,137 |
| Returning users | 1,013 | 802 |
| Average engagement time per active user | 12m 48s | 4m 08s |
| Engaged sessions per active user | 3.13 | 1.69 |
| First came direct | 2,513 | 2,222 |
| First came from Google search | 473 | 367 |
| First came from another website | 325 | 113 |
| First came from social media | 11 | 297 |
| First came from video | 9 | 152 |
EF-Map averaged 12m 48s per user over its three months, about three times EO-Map's 4m 08s, and its returning users came back about 13 times each. I think a big part of that is the stage it was at. By November EF-Map already had a core of players who'd been using it since the summer, and EO-Map's window starts in launch week, when lots of people are just having a look.
The Reddit posts are a good example. I pushed EO-Map pretty hard on Reddit in its first couple of months, and as far as I can tell those are most of the big days. A battle report video got about 23,000 views on there and a trailer about 16,000. EO-Map's biggest day so far was 22 September with 274 users. But on the big days people averaged around two minutes each, about half the normal figure. They had a look and most of them left. That's when I stopped chasing it. I think the people who stick around come from word of mouth and from searching for something they actually need, so these days I mostly leave Reddit alone and let search do its thing. EO-Map's most recent month averaged 5m 06s, up from 3m 08s the month before, so it's going the right way, but it's nowhere near ten minutes.
Why I think they're different
Some of it is the size of the games. EVE Frontier is small. My rough guess is maybe 900 people playing, with a core of two or three hundred who play every cycle. Most months this year EF-Map has had somewhere between about 700 and 1,400 users, and there's a ceiling on that because there are only so many players. EVE Online is a much bigger pond. It's harder to get noticed in, but it's my chance to reach a lot more people.
The other part is what each game already gives you. When I started EF-Map I thought EVE Frontier's own map was extremely limited, and in a game where getting from one place to another takes real planning, an outside map that worked was something people kept open and kept coming back to. EVE Online has a usable map in the client, autopilot, and third-party tools people have relied on for years. So I think EO-Map gets used more for a specific question. Where's the fighting, how do I get there, what's this system like. You get your answer and go back to the game. That's my theory, and GA4 can't prove it.
It's also worth knowing what engagement time actually measures. Google defines it as the time the site was in focus in the browser, so as I understand it a map sitting on a second screen while you're clicking around in the game mostly doesn't count. So nearly 13 minutes on EF-Map means nearly 13 minutes of it being the window people were in, not just sitting open somewhere. And a long engagement time isn't automatically a good thing. If somebody spends fifteen minutes fighting a clunky route planner, that's lots of engagement and a bad experience. If EO-Map answers a question in two minutes, that might be exactly what it should do. I honestly don't know which way round that is yet.
The social and video rows are the other big difference. 297 EO-Map users first arrived from social media and 152 from video, against 11 and 9 for EF-Map. Some of that is me. I had no way of making map videos in 2025, the tooling I use for that only dates from August this year, and I was posting on Reddit a lot early on. But GA4 can't tell me how much is my own posts and how much is other people sharing it.
What the numbers don't tell you
A few things I've had to keep reminding myself. Users over three months isn't monthly users. A returning user just means someone came back at least once, it's not a retention rate. Search Console clicks and GA4's Google search users are counted differently and won't match. Direct doesn't only mean people typing the address in, it's also anything GA4 couldn't work out, which on a site people share in Discord and bookmark is a lot. The two GA4 setups aren't identical either. In the windows I'm comparing both only ran on the map itself, not the static pages, but they log different events, and EO-Map lets people switch analytics off in its settings. And I've no idea how many players in either game want a third-party map in the first place, so I can't tell you what share of either audience any of this is.
What I took from it
EF-Map taught me how to get found. I think doing that work from day one gave EO-Map a head start, although the bigger game did a lot of the lifting too, and by three months both maps were getting the same clicks from Google and about the same number of users. That part I'm quite chuffed with.
What it didn't teach me, or at least what the numbers say I haven't cracked on EO-Map yet, is getting people to come back. At the same age, EF-Map's regulars came back twice as often and stayed nearly three times as long. Some of that is the game and some of it is timing, but some of it is probably the product, and that's the part SEO can't do anything about. Getting found and getting people to come back are two different things. I've got a decent handle on the first one now. The second one is what I want to spend more time on.
If you use EO-Map and there's something that would make you keep it open, let me know.