October was the first month in a long time where I didn't spend half of it bouncing off usage limits. As far as I can remember, everything I built went through Claude Code, mostly Opus 5.5 on extra high effort, on Anthropic's $200 plan. That plan was called Max 20x until 30 October, when Anthropic renamed it Ultra. At no point in the month did I get close to the weekly limit. The highest I remember seeing the meter was somewhere around 70%.
Claude Code keeps a transcript of every session on your machine, and every response the model sends back carries a token count. So I had the agent go through the whole month and count everything: sessions, the helper agents it started, which models did the work, how many tokens, how much time, and what it would all have cost if I'd been paying per token instead of a flat fee. I didn't realise there was that much in there. This is what came out, and it covers EO-Map and EF-Map, the EVE Frontier map I built first, plus the tools around them.
That $6,418 is what the same tokens would cost at Anthropic's published API prices. It isn't what I paid. I paid $200. It isn't what Anthropic spent serving them either, and nobody outside the company knows that number. I think it's a fair yardstick for how much work the plan did though, and it works out at about 32 times the subscription.
I've put this on the EF-Map blog as well, because both maps came out of the same month of work.
The month, day by day
API-equivalent cost per day
UK days, 1 to 31 October. Hover or tap a day for the hours.
Table view
| Day (UK) | API-equivalent | Hours with an agent working | Agent-hours |
|---|---|---|---|
| Thu 1 Oct | $59.87 | 2.2 | 2.5 |
| Fri 2 Oct | $36.22 | 1.6 | 1.8 |
| Sat 3 Oct | $15.72 | 0.9 | 0.9 |
| Sun 4 Oct | $248 | 9.6 | 14.0 |
| Mon 5 Oct | $105 | 5.7 | 6.1 |
| Tue 6 Oct | $225 | 9.7 | 10.6 |
| Wed 7 Oct | $186 | 8.1 | 9.0 |
| Thu 8 Oct | $170 | 6.4 | 10.4 |
| Fri 9 Oct | $444 | 12.0 | 29.1 |
| Sat 10 Oct | $235 | 8.7 | 11.7 |
| Sun 11 Oct | $118 | 4.9 | 5.8 |
| Mon 12 Oct | $280 | 11.0 | 12.2 |
| Tue 13 Oct | $304 | 12.2 | 14.4 |
| Wed 14 Oct | $261 | 9.0 | 10.3 |
| Thu 15 Oct | $575 | 11.1 | 26.3 |
| Fri 16 Oct | $171 | 6.2 | 9.3 |
| Sat 17 Oct | $348 | 14.5 | 17.4 |
| Sun 18 Oct | $283 | 15.2 | 17.6 |
| Mon 19 Oct | $345 | 9.9 | 15.4 |
| Tue 20 Oct | $433 | 12.4 | 17.5 |
| Wed 21 Oct | $131 | 4.2 | 6.4 |
| Thu 22 Oct | $208 | 8.0 | 10.6 |
| Fri 23 Oct | $147 | 5.8 | 7.6 |
| Sat 24 Oct | $145 | 6.3 | 10.0 |
| Sun 25 Oct | $31.85 | 2.1 | 2.3 |
| Mon 26 Oct | $124 | 4.7 | 6.3 |
| Tue 27 Oct | $180 | 4.0 | 7.2 |
| Wed 28 Oct | $259 | 6.0 | 10.5 |
| Thu 29 Oct | $95.94 | 5.4 | 7.2 |
| Fri 30 Oct | $142 | 3.7 | 7.1 |
| Sat 31 Oct | $110 | 4.3 | 5.0 |
Most days land somewhere between $100 and $350. The busiest was the 15th at $575, which was the night the agent caught EF-Map's translations up into six languages while another session made RootFit's packing faster. On the 9th there were nine agents working at once at one point, mostly helpers building a batch of visual upgrades for EO-Map side by side. The quietest days were the 3rd and the 25th, the Sunday the clocks went back. Hover or tap on a day for how many hours it had an agent working.
Where 19 billion tokens went
A token is roughly three quarters of a word. Nineteen billion sounds daft. It makes more sense once you see what they were.
19.1 billion tokens, one square per 100 million
The model wrote less than half of one square. Almost everything else is it re-reading the conversation.
Table view
| Kind of token | Tokens | Share |
|---|---|---|
| Read from the cache | 18,817,927,343 | 98.47% |
| Written to the cache (5 minute) | 144,627,965 | 0.76% |
| Written to the cache (1 hour) | 107,526,028 | 0.56% |
| Output, including thinking | 40,942,742 | 0.21% |
| of which thinking | 16,038,820 | 0.08% |
| Uncached input | 187,330 | 0.001% |
Almost all of it is the model re-reading. Every time the agent takes a step, runs a command, reads a file, makes an edit, the whole conversation so far goes back to the model and it reads the lot again. Across the month that averaged about 296,000 tokens per step, over 64,320 steps. Prompt caching is what makes that bearable. When the start of the conversation hasn't changed since the last step, the model reads it from a cache at a fraction of the price, and 98.7% of everything the models read in October came from the cache. The part the models actually wrote, all the code and replies and thinking, was 41 million tokens. That's less than half of one square on that chart.
Where the $6,418 API-equivalent goes
By kind of token, at list price.
Table view
| Part of the bill | API-equivalent | Share |
|---|---|---|
| Cache reads | $3,799 | 59.2% |
| Cache writes, 1 hour | $943 | 14.7% |
| Output and thinking | $914 | 14.2% |
| Cache writes, 5 minute | $760 | 11.8% |
| Uncached input | $1.11 | 0.02% |
| Total | $6,418 | 100% |
Cheap per token doesn't mean cheap overall though. Re-reading from the cache is still 59% of the API-equivalent cost, just because there's so much of it, and writing into the cache is another 27%. Everything the models wrote, thinking included, comes to 14%. So the cost isn't really the agent writing code. It's long sessions, where every small step re-reads a big conversation. Some of mine run for a day or more.
Which models did the work
API-equivalent cost by model
94% of all requests ran at extra high effort.
Table view
| Model | Requests | Output tokens | Cache reads | API-equivalent |
|---|---|---|---|---|
| Opus 5.5 | 60,343 | 37,314,233 | 17,887,804,699 | $5,756 |
| Fable 5.1 | 2,160 | 3,276,472 | 717,009,211 | $589 |
| Sonnet 5.5 | 1,718 | 338,529 | 203,297,008 | $68.70 |
| Sonnet 5 | 86 | 12,380 | 9,076,058 | $3.46 |
| Haiku 5.5 | 13 | 1,128 | 740,367 | $0.03 |
Opus 5.5 did 94% of the requests and 90% of the API-equivalent cost. I run it on extra high effort and the logs agree, 94% of every request in the month went out at that setting, helpers included. It has been an absolute champ this month. I wrote about why it changed how I work in Opus 5.5 Changed How I Use AI Agents, and October is basically that, for a full month.
Fable 5.1 was next at $589. In that post I said I hadn't touched Fable since Opus 5.5 came out, and that stopped being true in the middle of October. I'd assumed that was all RootFit, and some of it was, because two of the RootFit sessions ran partly on Fable in the main conversation. But the biggest single chunk, $259 of it, was the EO-Map killboard night, where Fable helpers did a lot of the work. Sonnet 5.5 did $69 worth, all of it as helper agents, and Haiku barely registers.
Agents and subagents
Claude Code can start helper agents, called subagents, to go off and do a piece of work and report back. A research job, a review, a batch of edits in parallel. The main agent, the orchestrator, writes their brief and picks their model. I've told it to use subagents where it makes sense and to choose the model itself, and then I mostly leave it to it.
Main agents and subagents, side by side
Table view
| Main agents | Subagents | |
|---|---|---|
| Count | 185 | 477 |
| Requests | 31,395 | 32,925 |
| API-equivalent | $3,939 | $2,479 |
| Agent hours | 171 | 151 |
| Output tokens | 33,112,156 | 7,830,586 |
| Cache writes | 107,526,028 | 144,627,965 |
So that's 477 helpers across 185 sessions, about two and a half per conversation, and between them they did 39% of the cost and nearly half of the agent time. 451 of the 477 ran in the background, which means the main agent kept working, or kept talking to me, while they ran. They wrote a lot less than the main agents though, because most of their job is reading and reporting back.
Which model the orchestrator picked for 477 subagents
Table view
| Model the orchestrator asked for | Subagents |
|---|---|
| Opus 5.5, asked for by name | 184 |
| No model named | 185 |
| Sonnet | 91 |
| Fable 5.1 | 16 |
| Haiku 5.5 | 1 |
When it named a model, it named Opus 184 times, Sonnet 91 times, Fable 16 times and Haiku once. Another 185 didn't name one and got the session's own model, which in practice was Opus.
Average API-equivalent cost per subagent
Not like for like: the cheaper models tend to get the lighter jobs.
Table view
| Model | Subagents | API-equivalent | Average per subagent |
|---|---|---|---|
| Opus 5.5 | 368 | $2,141 | $5.82 |
| Fable 5.1 | 16 | $266 | $16.60 |
| Sonnet 5.5 | 86 | $68.70 | $0.80 |
| Sonnet 5 | 5 | $3.46 | $0.69 |
| Haiku 5.5 | 2 | $0.03 | $0.01 |
An Opus helper averaged about $5.80 of API-equivalent tokens and a Sonnet one about 80 cents. That's not like for like, because the orchestrator tends to give Sonnet the lighter jobs like lookups and web searches, and Opus the ones that need judgement. My view is that if it's picking Opus, it's picking it for a reason. The logs give a hint on speed too. The median Sonnet helper was busy for about two and a half minutes and the median Opus one about 12, though again Sonnet got the smaller jobs. I might try nudging it towards Sonnet more often to see if things come back faster. On cost alone though it doesn't matter to me while I'm nowhere near the weekly limit, and if anything this tells me I could be using more subagents, not fewer.
Time, and what running agents in parallel bought me
Over the month there was at least one agent working for 226 hours of real time. That's about 30% of every hour in October, day and night. Add up each agent separately though and it comes to 323 hours, because a lot of the time more than one was running. If one agent had done all of it back to back, it would have needed about 97 more hours, which is four days of running round the clock. About 69 of those hours were helpers working alongside their own main agent. The other 28 were separate sessions I had going at the same time.
How many agents were working at once
Hours of real time in October, out of 226 busy hours.
Table view
| Agents working at once | Hours | Share of busy time |
|---|---|---|
| 1 agent | 169.6 | 75.2% |
| 2 agents | 33.2 | 14.7% |
| 3 agents | 12.0 | 5.3% |
| 4 agents | 6.7 | 3.0% |
| 5 agents | 2.4 | 1.1% |
| 6 to 9 agents | 1.7 | 0.8% |
Most of the time it's just the one agent, 75% of the busy hours. Two at once is another 15%. The peak was nine at once, at 19:16 on 9 October.
When the agents were working
Every row is a day and every column an hour. 32% of the busy time was between midnight and 7am.
Table view
| Hour of day (UK) | Busy hours over the month |
|---|---|
| 00:00 | 9.7 |
| 01:00 | 10.4 |
| 02:00 | 12.9 |
| 03:00 | 10.5 |
| 04:00 | 9.8 |
| 05:00 | 10.1 |
| 06:00 | 9.3 |
| 07:00 | 7.0 |
| 08:00 | 9.0 |
| 09:00 | 13.0 |
| 10:00 | 10.7 |
| 11:00 | 13.7 |
| 12:00 | 12.8 |
| 13:00 | 11.7 |
| 14:00 | 10.5 |
| 15:00 | 9.6 |
| 16:00 | 8.4 |
| 17:00 | 4.6 |
| 18:00 | 3.8 |
| 19:00 | 4.5 |
| 20:00 | 6.0 |
| 21:00 | 8.8 |
| 22:00 | 7.7 |
| 23:00 | 11.2 |
The heatmap shows when. The columns from midnight to 7am are nearly as busy as the afternoons, and 32% of all the busy time fell in those hours. Those are the overnight runs, where I give it a big job before bed and look at what it did in the morning. I wrote about the first of those in the unattended overnight run. The quietest stretch is early evening.
I sent 748 prompts in October, plus about 90 messages while an agent was already mid-task, usually steering it or adding something I'd forgotten. That works out at about 26 minutes of agent work for every prompt I sent. Most of them were dictated rather than typed, which I wrote about in my dictation post.
77,725 tool calls, the top eight
Table view
| Tool | Calls |
|---|---|
| Shell commands | 51,603 |
| Reading files | 9,030 |
| Editing files | 6,532 |
| Writing new files | 4,519 |
| Searching code | 1,772 |
| PowerShell commands | 823 |
| Web searches | 704 |
| Fetching web pages | 655 |
| All tool calls | 77,725 |
The agents made 77,725 tool calls. Two thirds of those were shell commands, which is builds, tests, git, deploys, screenshot scripts and queries against my server. Reading files was 9,030 calls, edits 6,532 and new files 4,519. They searched the web 704 times and fetched 655 pages.
The ten most expensive sessions
These ten sessions were 36% of the month's API-equivalent cost. A session here is one conversation with the main agent, counted with every helper it started. Claude Code names each session itself, which is how I ended up with one called "Refuge LNS repair tuning on rootfit" that I didn't remember at all. I've given them plainer titles here. Click any picture for the full size.
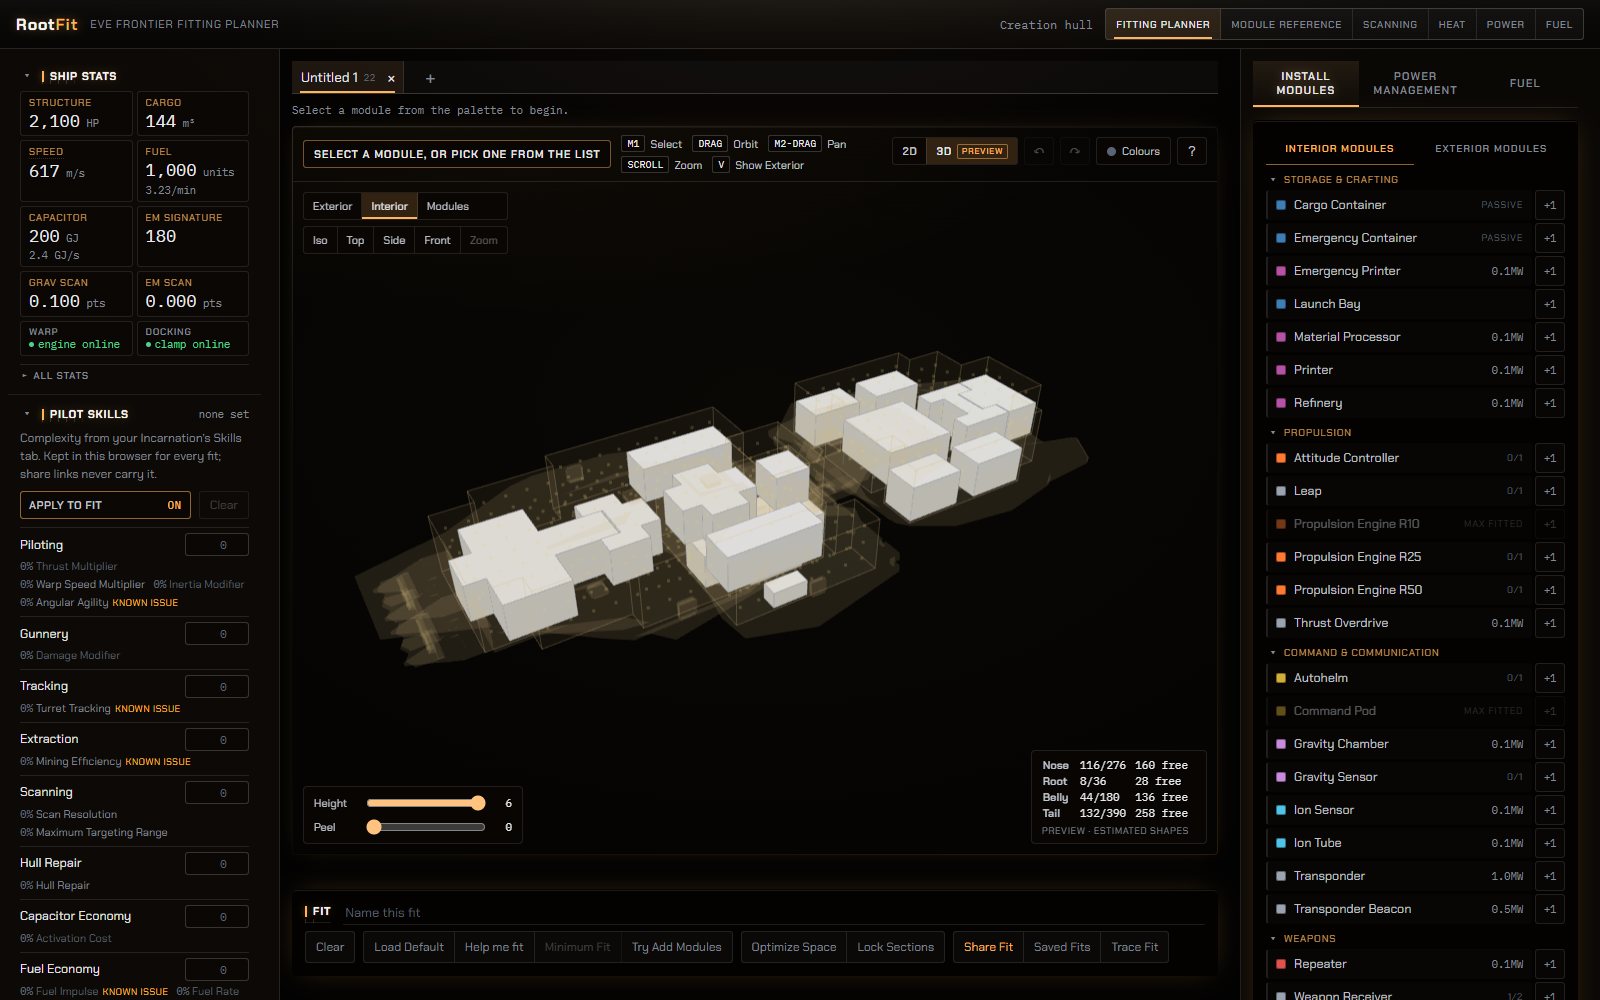
A 3D fitting preview for RootFit
Fenris Creations showed a 3D ship fitting screen on a stream, so I gave the agent the clip and had it build an unofficial preview in RootFit. You can click modules into the real ship model in 3D, or build your own hull from parts. The shapes are estimates until the real thing ships.
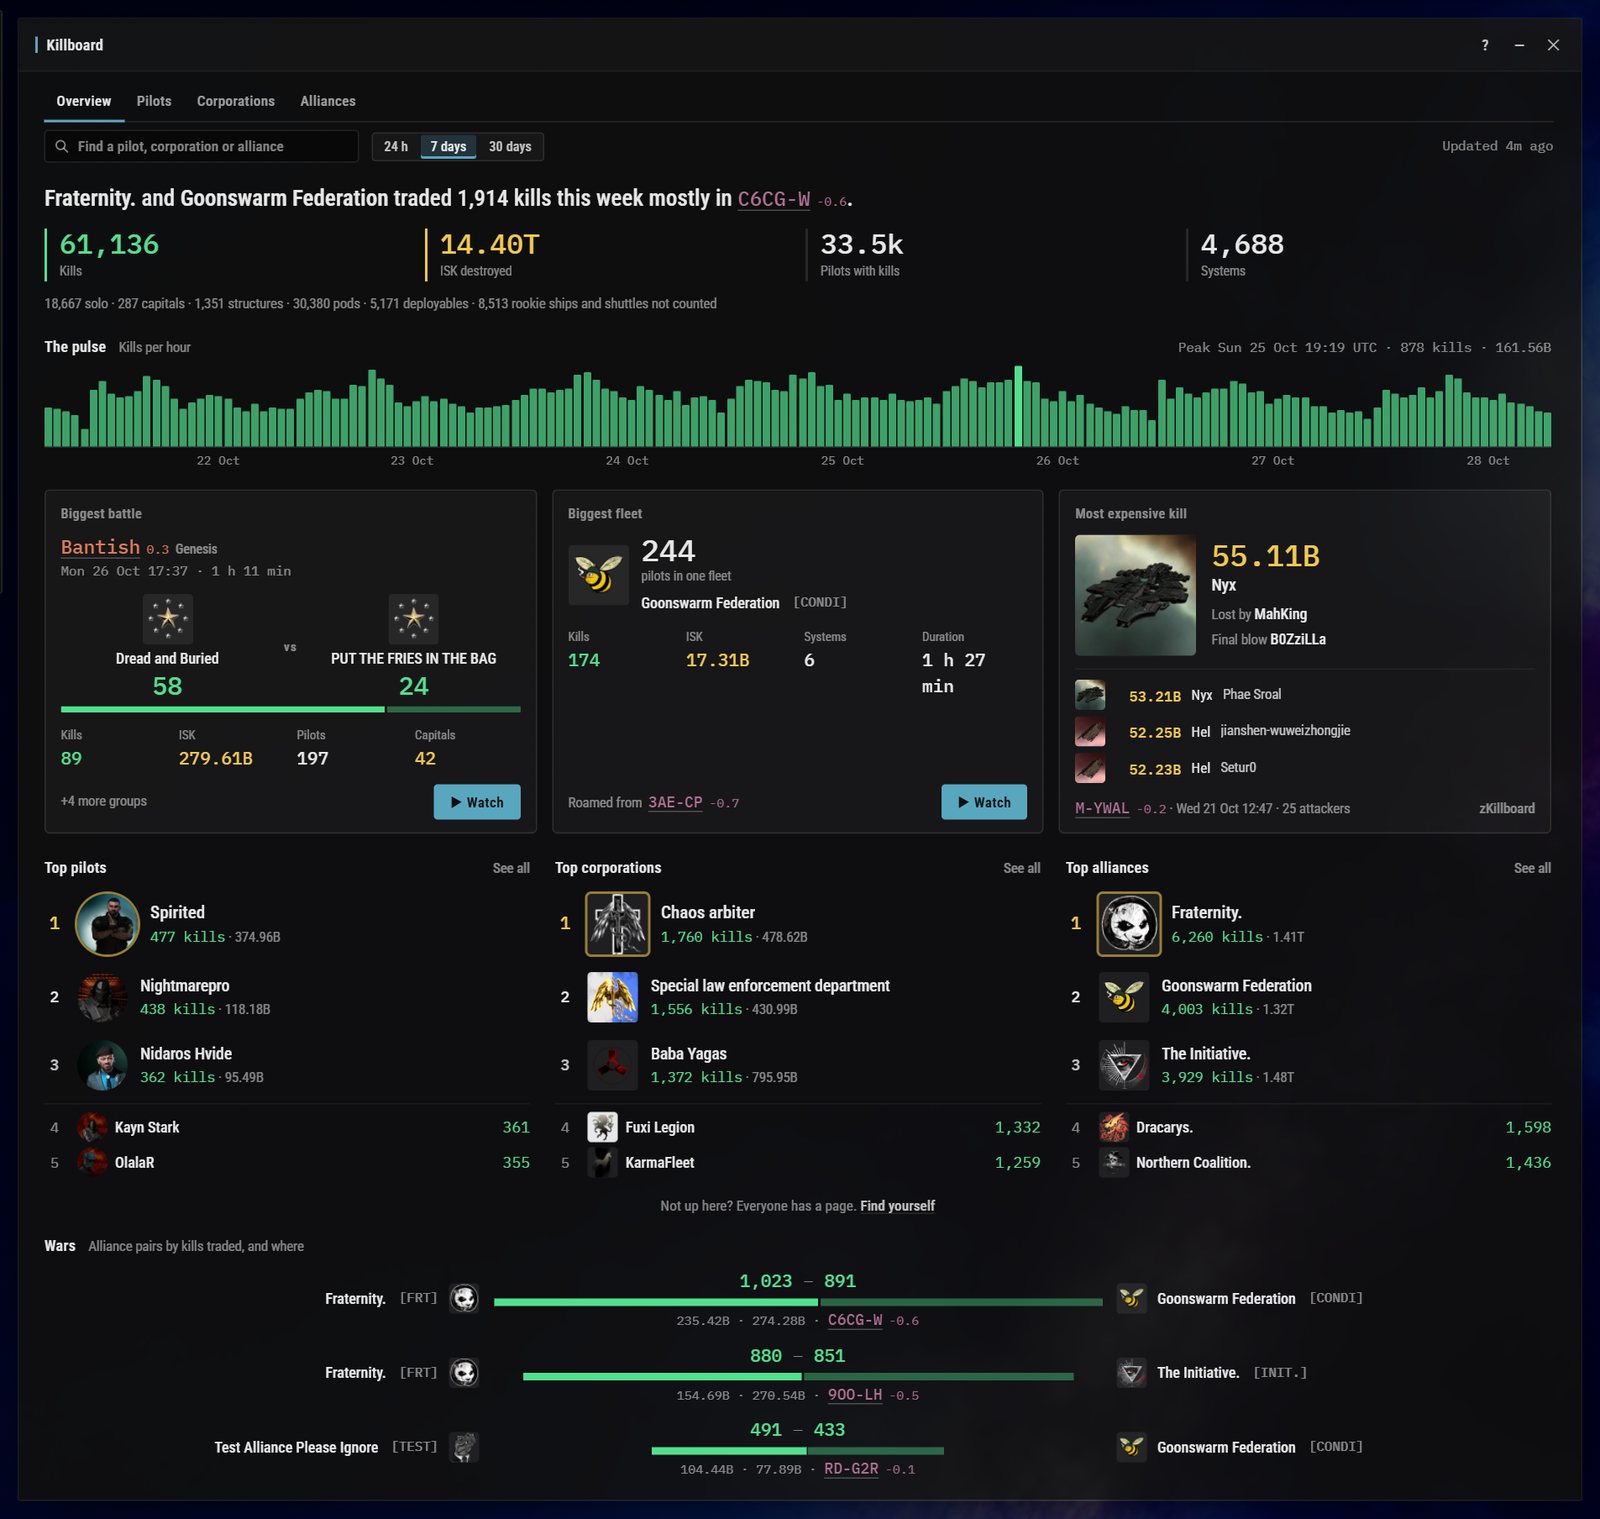
A killboard for EO-Map, built overnight
Top pilots, corporations and alliances, with rings on the map sized by how much fighting happened in each system. It was built while I slept, then I spent the next morning on feedback rounds: search, exact ranks, a 30 day window and a padding watch.
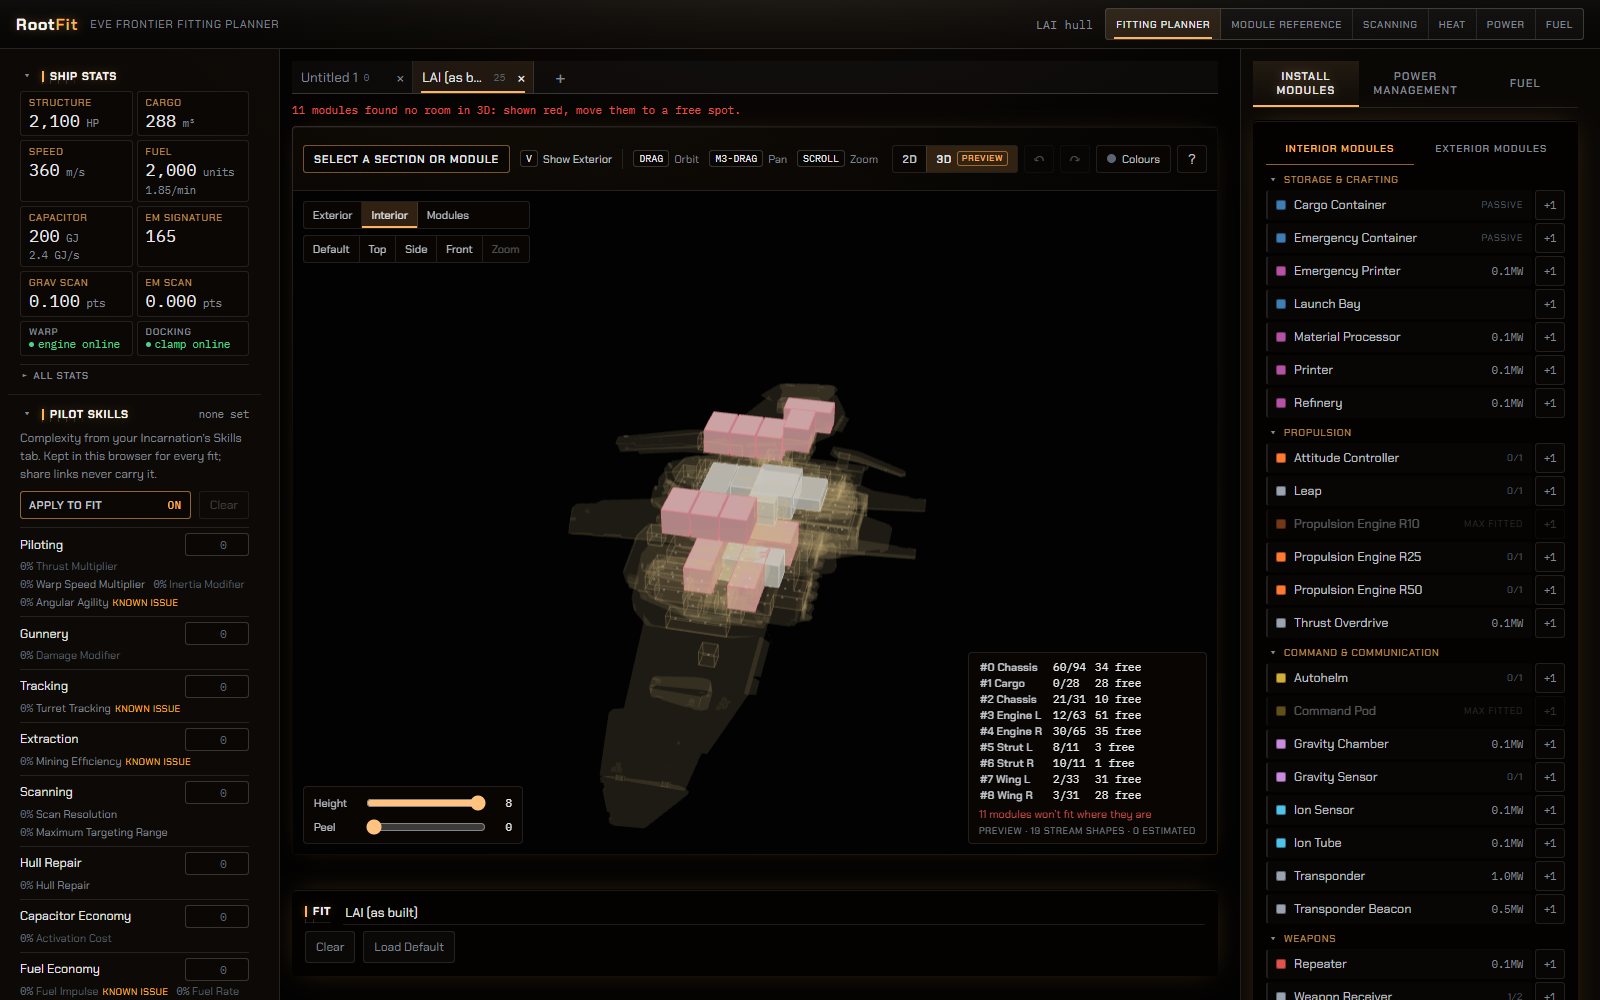
Making 3D packing actually work
RootFit already packed modules into a ship automatically in 2D. This session picked up after an earlier one died in an overnight restart, got the same packing working in 3D, and gave the 3D view a new look with a proper sky.
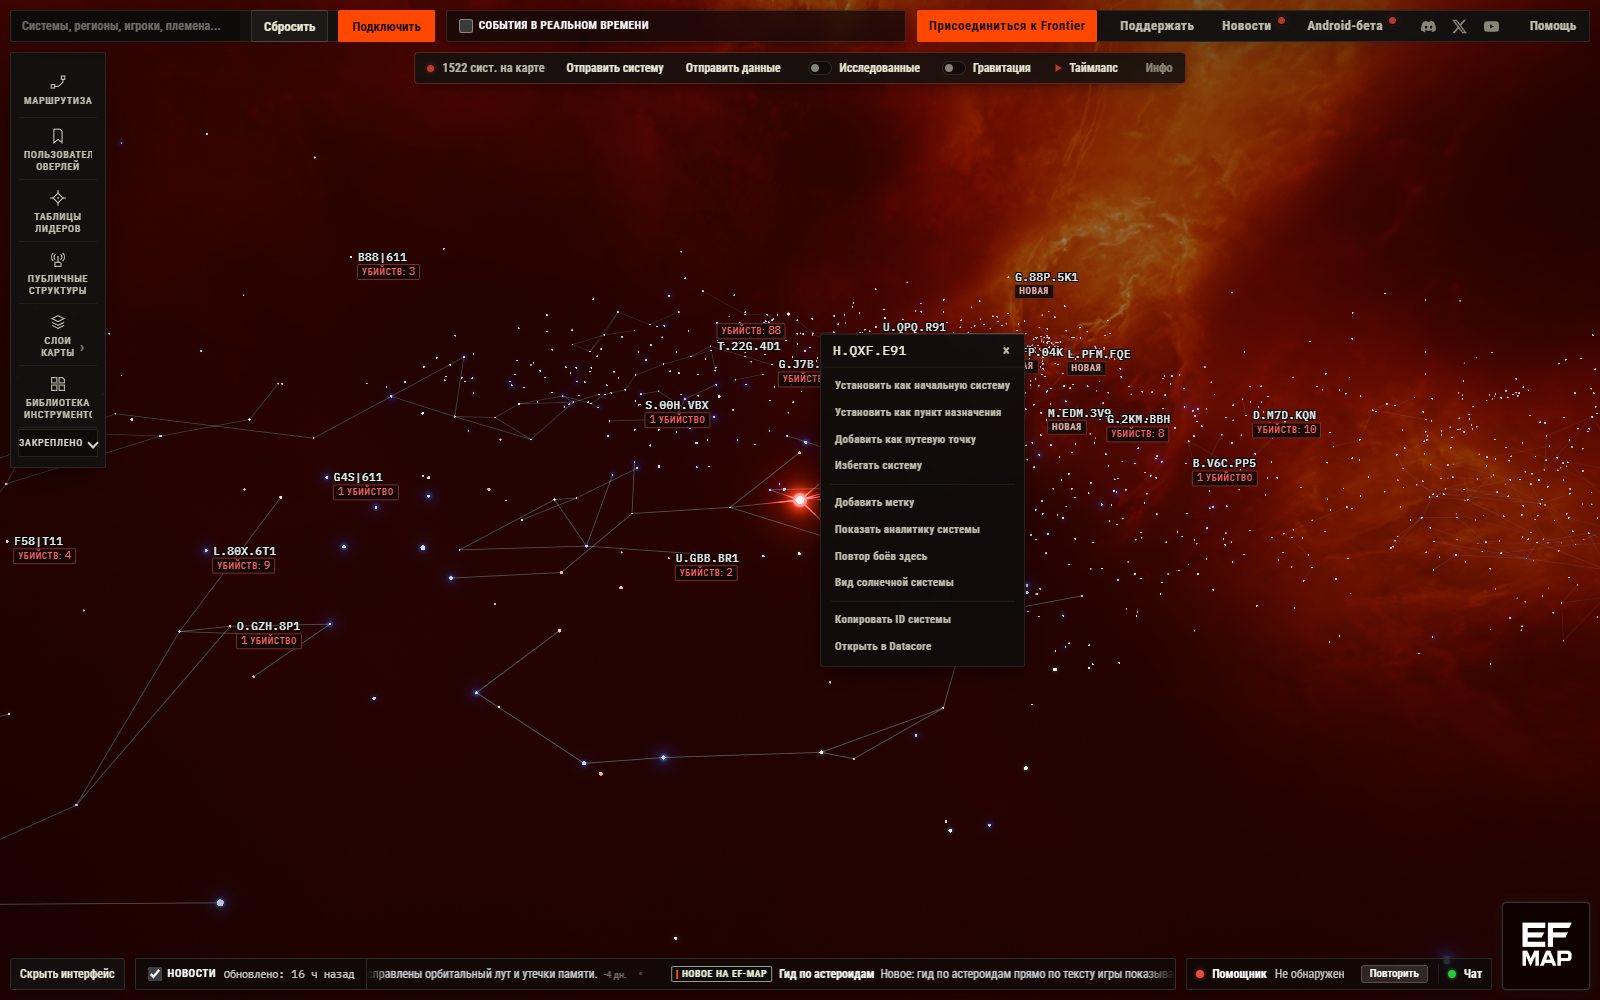
Catching up six languages in one night
Cycle 7 had left a lot of English behind. Overnight the agent machine-translated 1,248 missing strings into six languages, made 556 hard coded ones translatable, and checked screenshots of every language. The star right click menu followed the next morning.
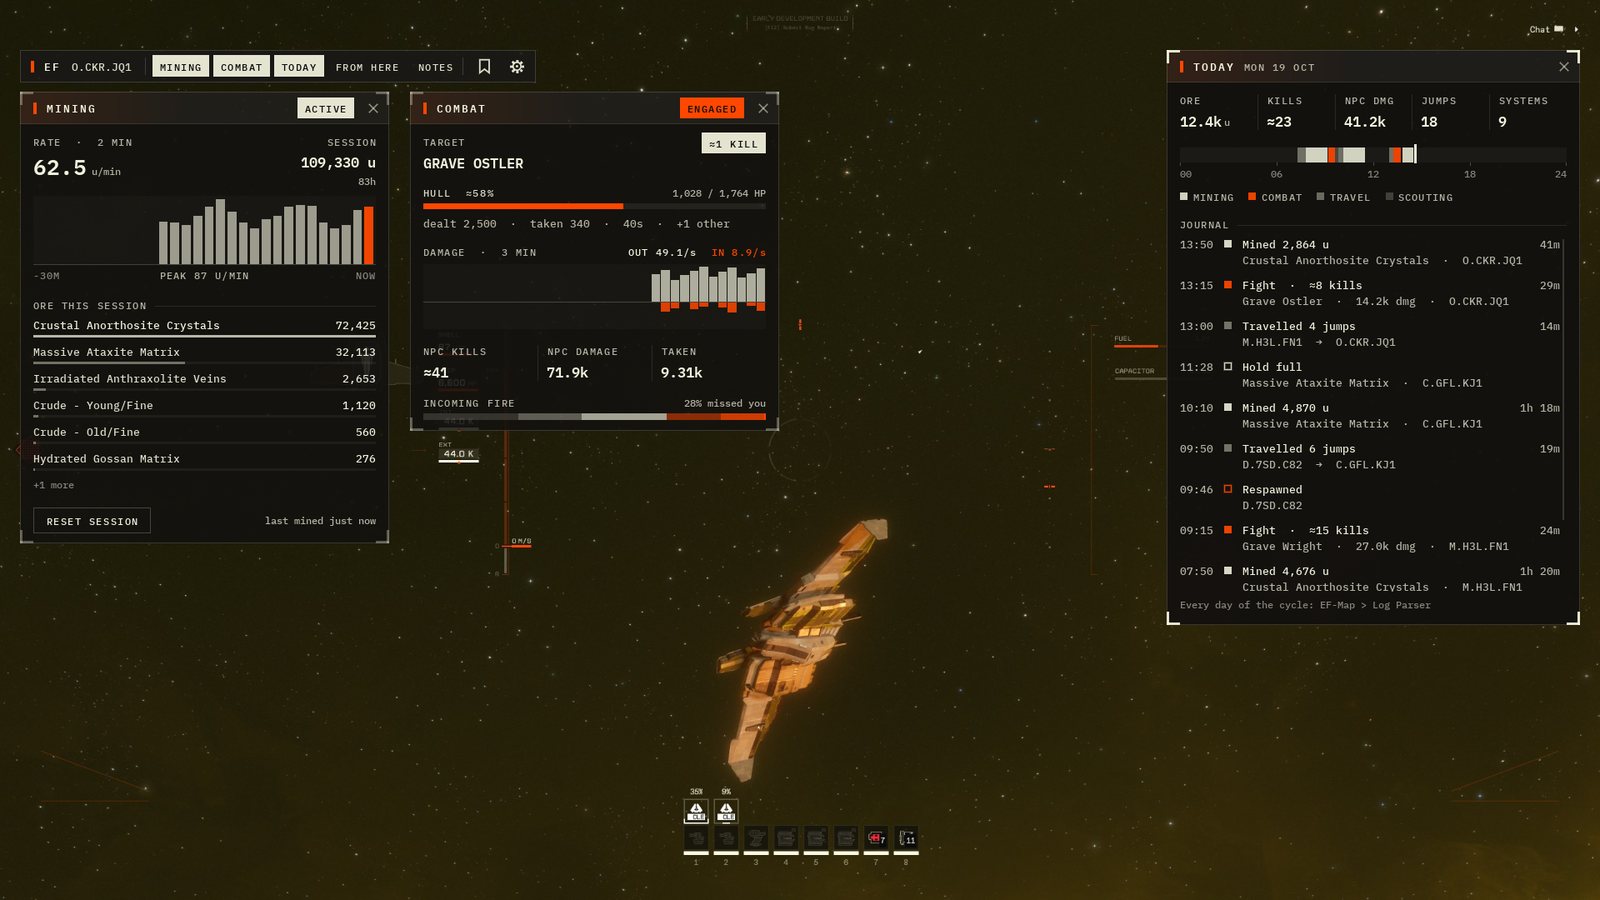
Rebuilding the in-game overlay
Version 1.2 of the overlay that draws map information over the game: a From Here card for the system you're in and a quicker bookmark form. I tested it in game, and the text got sharper after my feedback.
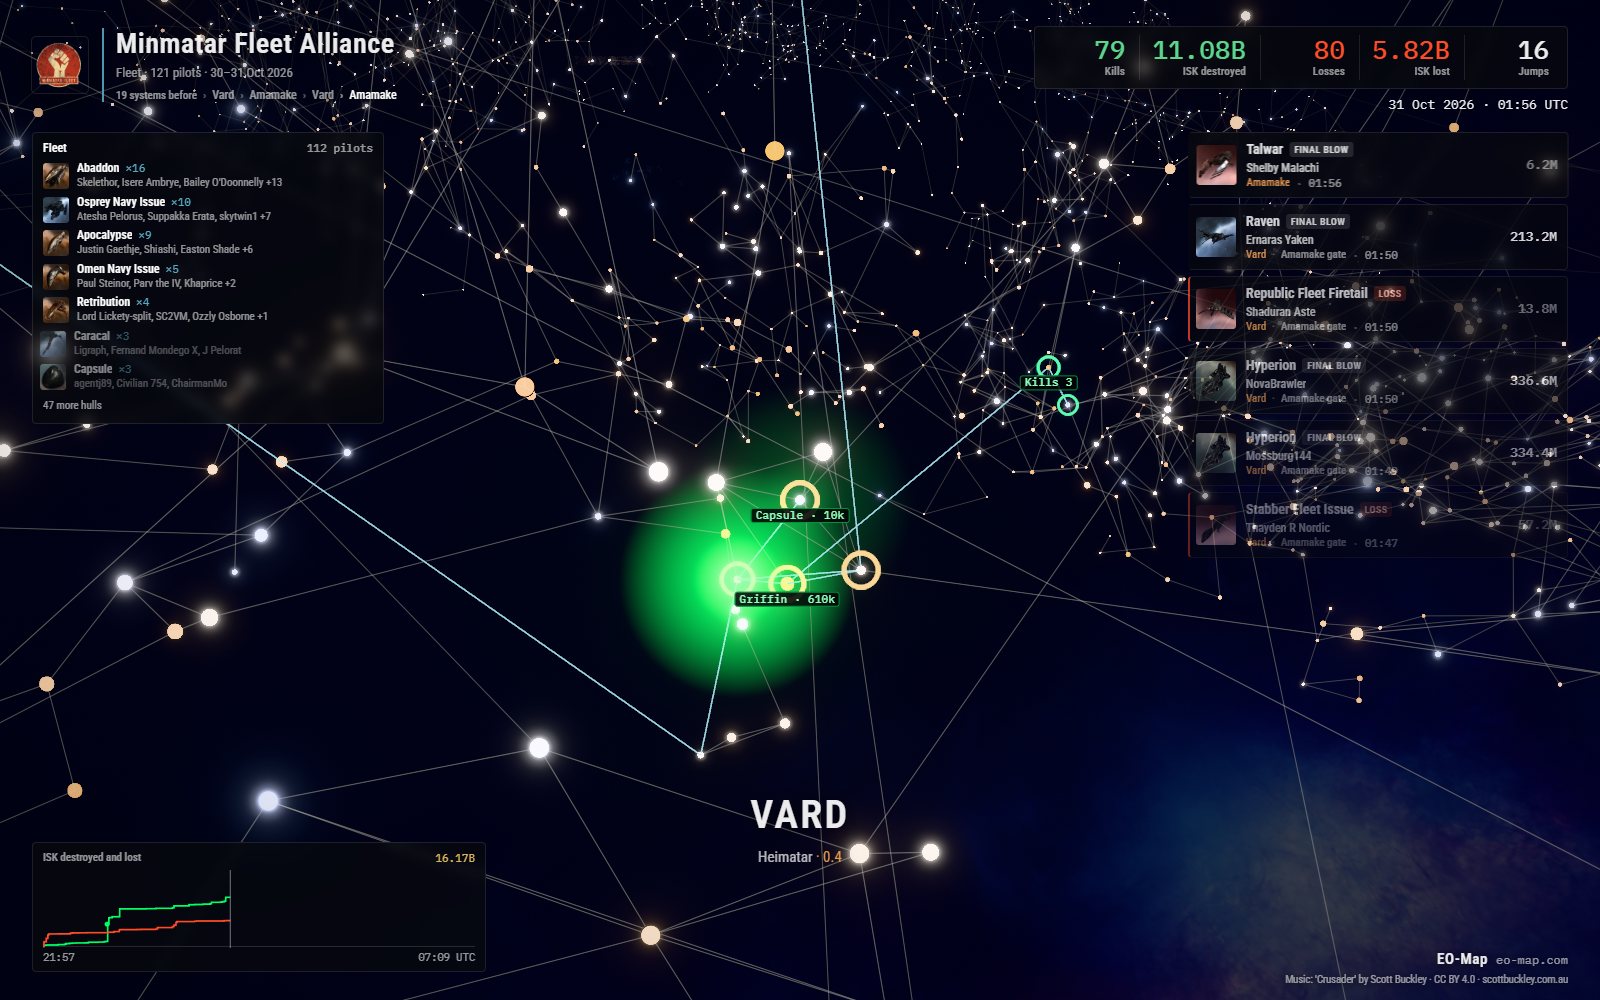
Replaying a whole fleet fight
A player who runs fleet reports asked for a way to replay a fleet's fight. Fleet Replay finds the fleet from its killmails and plays the battle back on the map with a moving camera and music. It went live the same day.
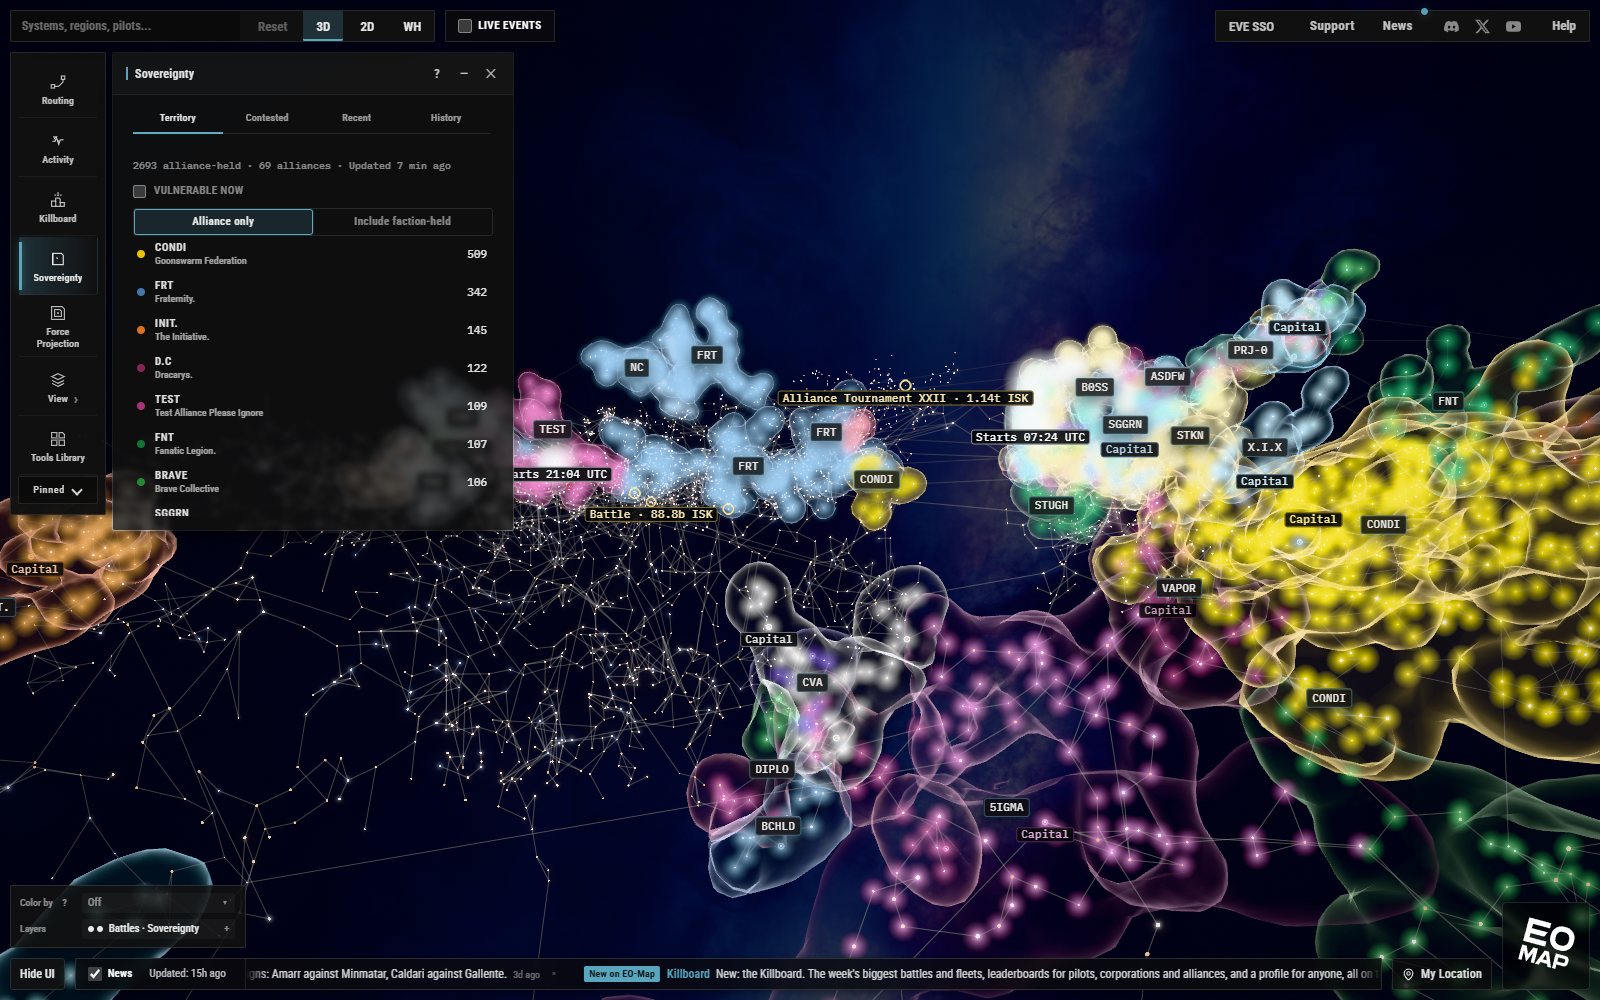
A visual pass for EO-Map
I asked for premium visual upgrades and the agent built 18 of them in parallel. I kept all of them. The next day it added 3D territory shells that rise out of the flat sovereignty map.
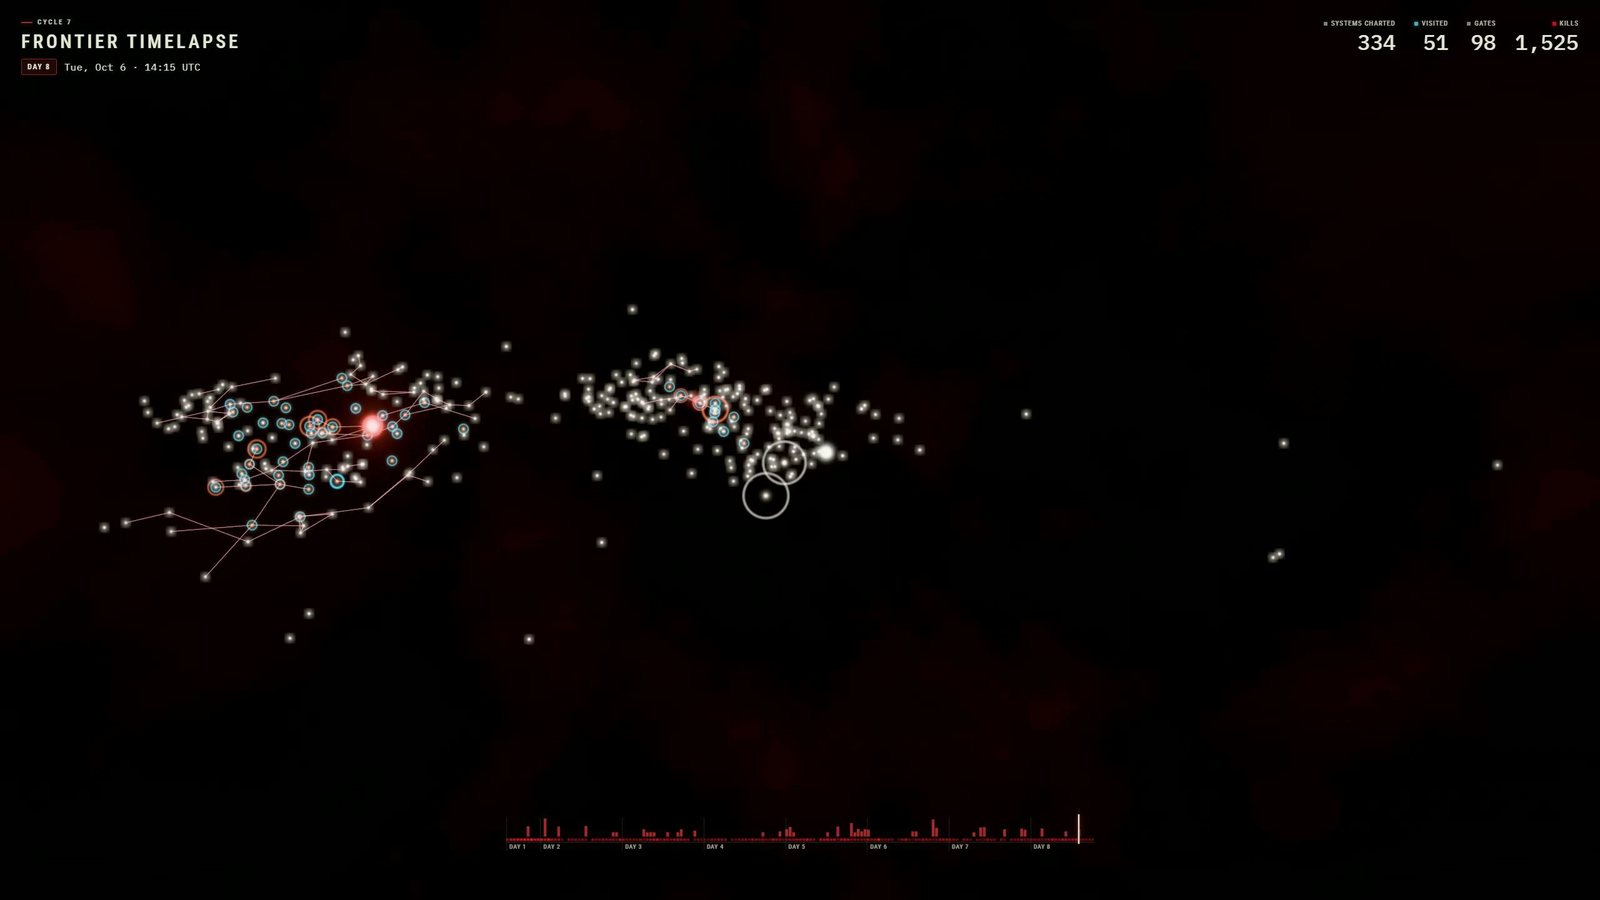
Cycle 7 effects for EF-Map
With players charting the map star by star this cycle, it built the Frontier Timelapse, a replay of the map being discovered, plus a glow for new discoveries, heat rings and a live kill hover.
The one I couldn't remember
Refuge is the hardest ship in RootFit to pack, and LNS is the search behind the Try Add Modules button: clear a patch of the ship, re-pack it, keep it if it's better. The agent profiled it overnight and made it about three times faster on the Refuge.
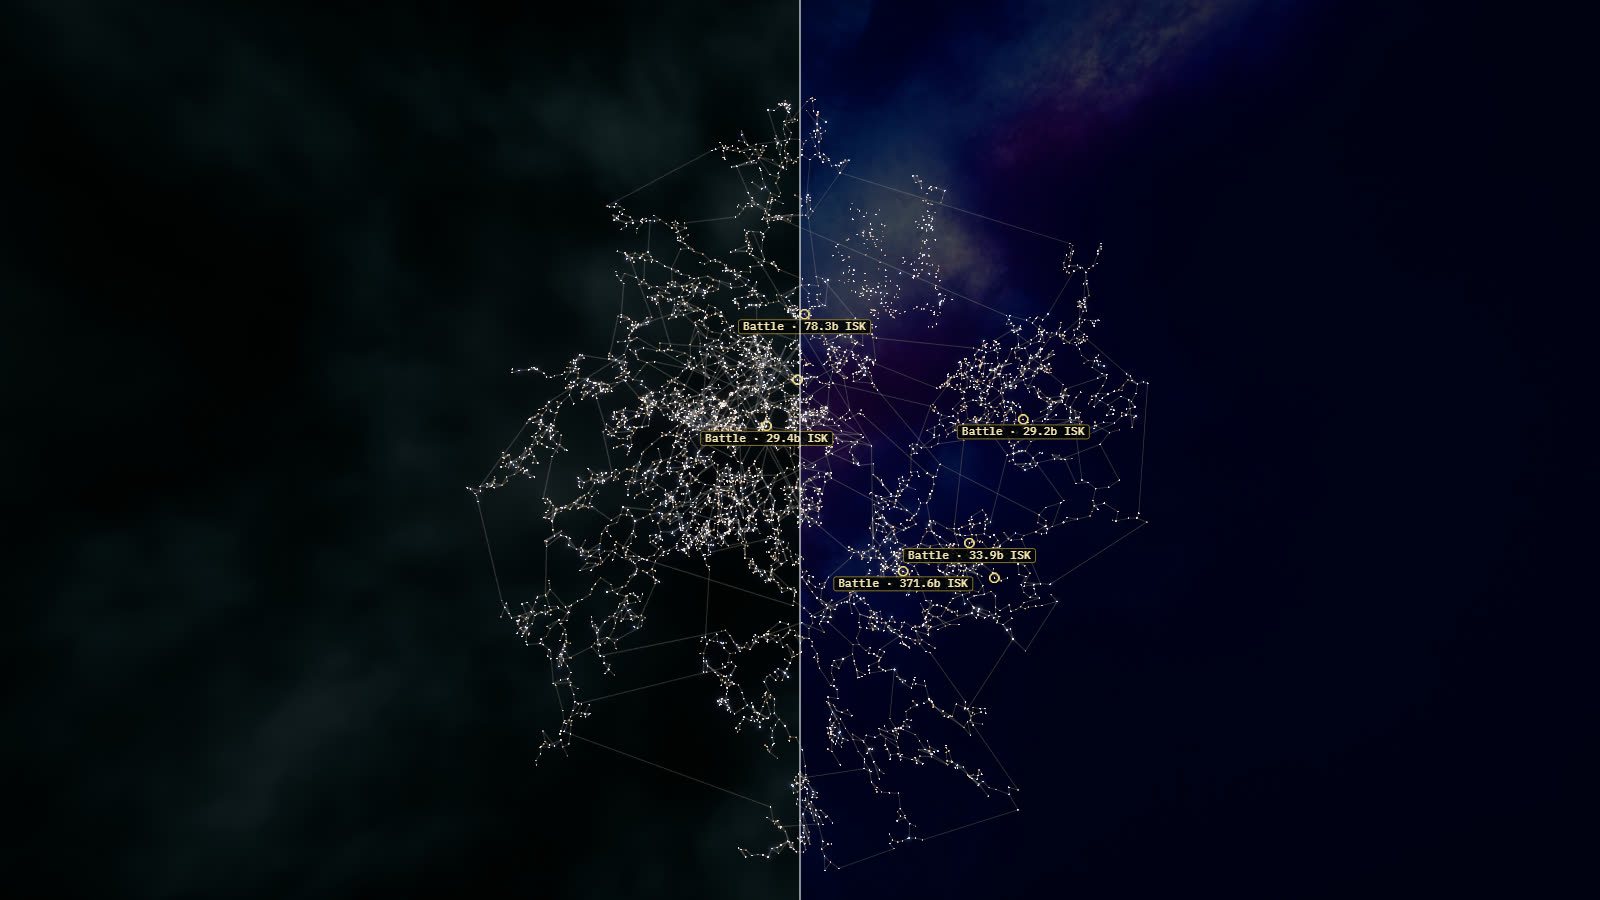
EF-Map's polish, copied to EO-Map
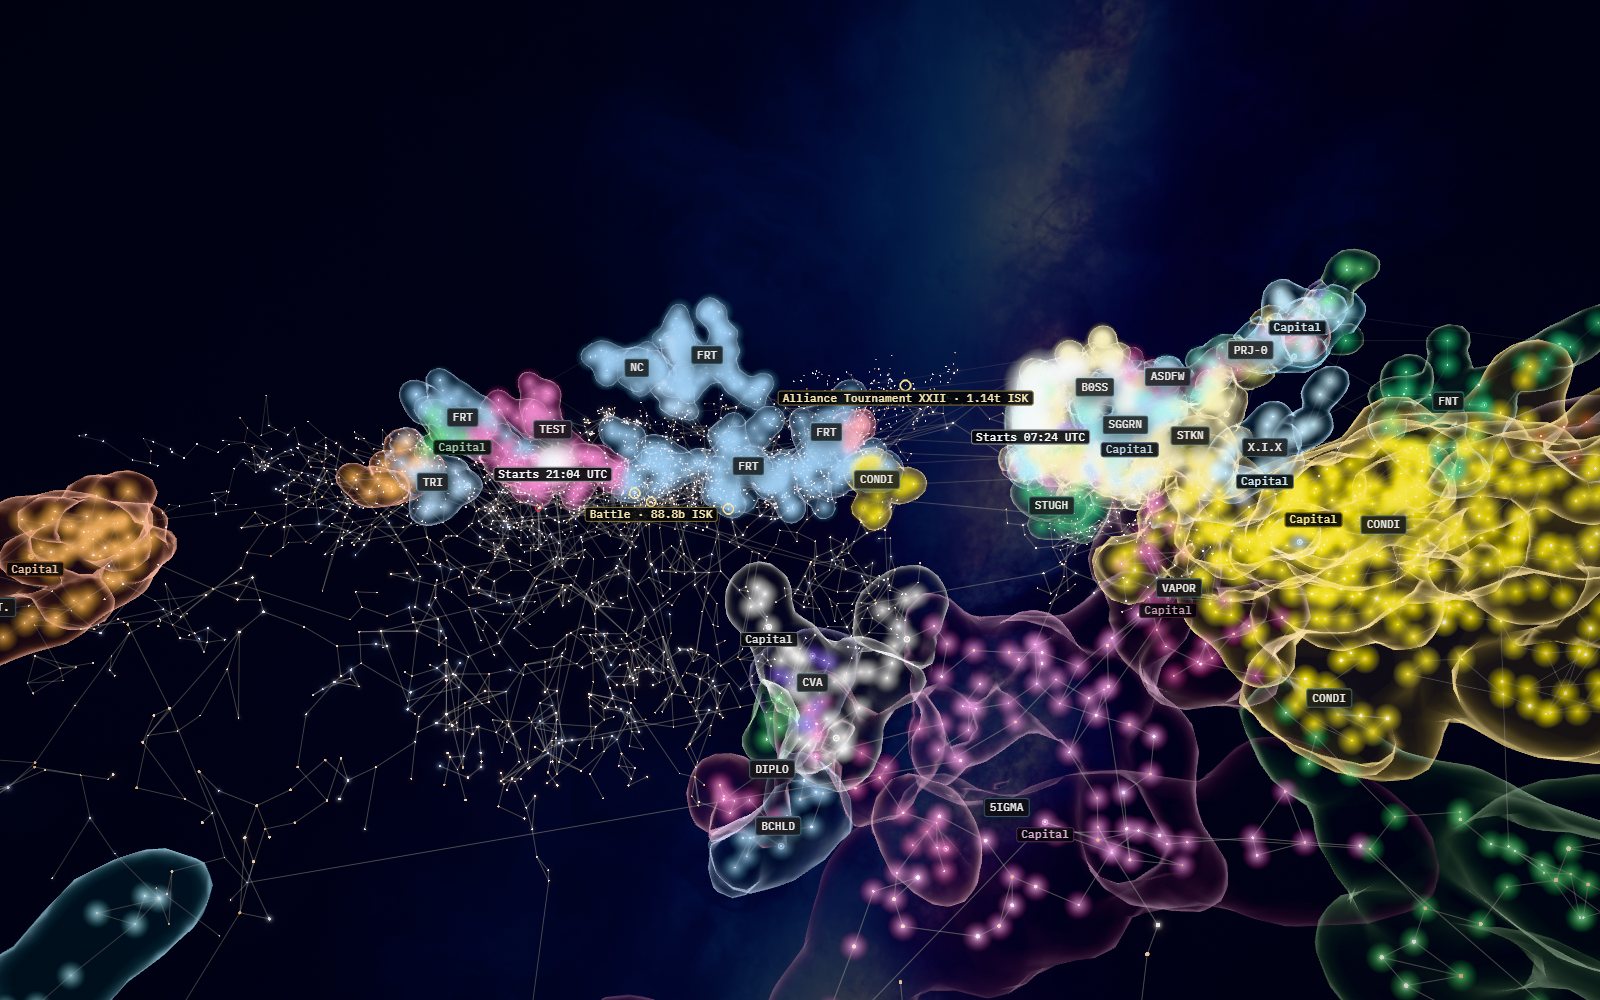
EO-Map started as a copy of EF-Map, so when a batch of polish landed on EF-Map I had it carried across: the loading hand-off, route reveal, crisp gate lines, the selected star glow and the sky on phones.
Only two of the ten were EF-Map itself. Four were EO-Map, three were RootFit and one was the overlay, the Windows helper that draws EF-Map information over the game. The most expensive was the RootFit 3D preview, which ran across 27 hours with 22 hours of agent time in it.
By product
API-equivalent cost by product
Table view
| Product | API-equivalent | Share |
|---|---|---|
| EF-Map | $3,987 | 62.1% |
| EO-Map | $1,097 | 17.1% |
| RootFit | $862 | 13.4% |
| EF Helper overlay | $268 | 4.2% |
| CivilizationControl | $119 | 1.8% |
| Everything else | $85.18 | 1.3% |
EF-Map is still most of it at 62%. EO-Map took 17%, RootFit 13% and the overlay 4%. I've moved two sessions to the product they were really about, the RootFit 3D preview and the overlay rebuild, because I started both of them from the EF-Map folder.
The other $200: API credit
The $200 plan also comes with $200 a month of credit for Anthropic's API, which is separate from Claude Code and can't be used by it. It doesn't roll over either. I started using it on 20 October for a handful of jobs that run on a schedule on my server. The news ticker on EF-Map is the main one: Sonnet reads new game news, posts and videos as they come in, Opus writes the ticker lines when something has changed, and Sonnet translates them into six languages. EO-Map has run its own copy of the same ticker since 21 October, on the same key. There's an hourly check on Haiku that screens new map names, player reports and translation suggestions for anything I need to moderate. And a few reports post to a private channel on my Discord: a morning note on the health of the server, which only calls a model when something is wrong, a weekly list of questions the Intelligence console couldn't answer, and a weekly check where Opus compares what my public pages say against what actually changed that week.
API credit used by the scheduled jobs: $14.34 of $200
List-price spend each job records for itself, 20 to 31 October. EO-Map's ticker shares the same key.
Table view
| Job | Spend, 20 to 31 October |
|---|---|
| News ticker | $5.08 |
| Weekly stale-claims check | $1.50 |
| Moderation reviewer | $0.05 |
| Morning ops note | $0.00 |
| Unanswered questions digest | $0.00 |
| EO-Map news ticker | $7.71 |
| Total | $14.34 |
From 20 to 31 October those jobs used $14.34, going by the spend each one records for itself at list price. The two news tickers are 89% of it, and EO-Map's is the hungrier of the two. At the rate of the last week a full month comes to about $35, so there's still a lot of room left. I'll probably find more for it to do.
Was it worth $200?
$200 a month is a lot of money for what is a hobby. I think this shows I'm getting the use out of it though. That's 185 conversations and 323 hours of agent time, on a flat fee I never got near the top of. Opus 5.5 did nearly all of it.
The bit that surprised me is that the limit isn't what holds me back any more. What holds me back is how quickly I can check what comes back and decide what's next. I still read the closeouts, test things and send it back when it's wrong. That's most of what those 748 prompts were.
From now on the plan is called Ultra, and verified Ultra accounts lose the five-hour limit as well. The weekly limit hasn't changed and that's the one I watch, so I don't expect much to change for me. If you're on one of these plans and you've wondered where it all goes, the transcripts are in the .claude folder in your home directory, and any agent can count them for you. That's all this was.
How I counted
The numbers come from the Claude Code transcripts on my main PC, from 1 October to the afternoon of 31 October. Sessions on my laptop aren't included, and neither is the session that wrote this up. Claude Code logs a streamed response several times, so each response is counted once, by its request ID. It keeps 30 days of transcripts by default, so the start of the month was only just still there.
The API-equivalent cost uses Anthropic's list prices per million tokens, in the table below. Writing to the cache costs 1.25 times the input price for the five-minute cache and twice the input price for the one-hour cache. Main sessions in Claude Code use the one-hour cache and subagents the five-minute one, which shows up cleanly in the numbers.
| Model | Input | Output | Cache write, 5 min | Cache write, 1 hour | Cache read |
|---|---|---|---|---|---|
| Opus 5.5 | $4.00 | $20.00 | $5.00 | $8.00 | $0.20 |
| Fable 5.1 | $10.00 | $50.00 | $12.50 | $20.00 | $0.25 |
| Sonnet 5.5 and Sonnet 5 | $2.00 | $10.00 | $2.50 | $4.00 | $0.20 |
| Haiku 5.5 | $0.10 | $0.50 | $0.125 | $0.20 | $0.01 |
Agent time is the time between one entry in an agent's transcript and the next, as long as the gap is under 20 minutes and the agent wasn't sitting waiting for me or for a background helper to finish. When the main agent was only waiting on a helper, I count the helper and not both. It probably over-counts a little, because a wait of up to 20 minutes on a permission prompt or a question the agent asked me still counts. Real time is the same periods merged together, so an hour with three agents running counts once. Times are UK time. Sessions are counted under the folder I started them in, apart from the two I moved. The 70% on the weekly meter is from memory, not from the logs.
Related posts
- Opus 5.5 Changed How I Use AI Agents, and My Logs Back It Up: the model that did nearly all of this
- The $300 AI month that built EO-Map, and the 44 cent sequel: September, when I was paying for several AI subscriptions at once
- EF-Map's polish, borrowed for EO-Map: the parity port from session ten