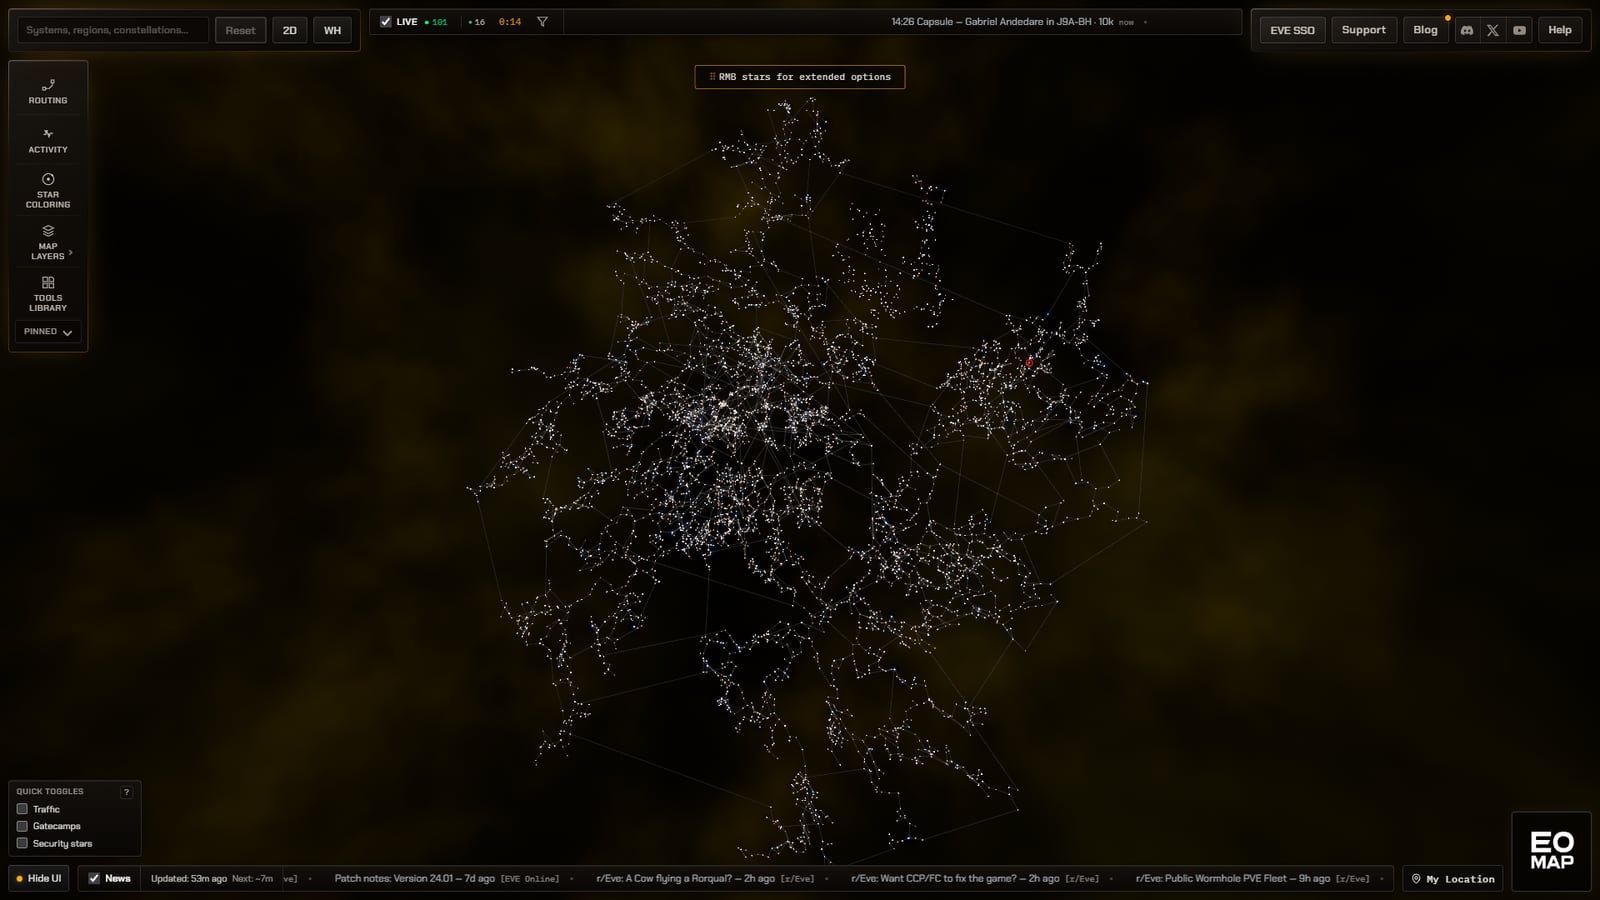
EO-Map has been live for about a month now, so I sat down and counted what the AI subscriptions behind it actually cost me and what they actually did. The short version is that I spent $300. The interesting version is 44 cents. I would still spend the $300 again, and this post is me trying to explain why both of those sentences are true at the same time.
Why I was in a hurry
I forked the map on 12 August and launched it on the 18th, which I wrote up in the origin post. When I counted on 15 September, main was 911 commits ahead of the mid August baseline, which works out at roughly 29 commits a day. Commits vary a lot and some of that is docs and fixes and deploy bookkeeping, so do not read it as 911 features, but the pace was deliberate and it was fast.
Part of the hurry was ignorance. I had not played EVE Online seriously since 2018, so I did not start with a working map of every useful public data source the way I did on my other project. I pointed coding agents at ESI, the SDE, EVE Ref, zKillboard, open source projects and the assorted community sources, and had them find out what could support a spatial product and what could not. A lot of the month's tokens went on research, not on building UI.
The bigger reason was history. A feature can be redesigned later. Historical data that was never collected often cannot be recovered later, or not in the shape you want. The question that kept coming up was what data I would wish I had started collecting six months ago. That is why Faction Warfare, public combat, alliance combat geography, markets, sovereignty and the other time varying data got investigated fast and got collectors early, even where the first visible version was rough.
I should be careful about one claim here. Some of that history can be rebuilt from public archives and community sources, so it would be an overclaim to say EO-Map owns the only copy of anything. What early collection buys is steadier and more boring than that. Continuous collection, one normalized schema, provenance on everything, and products designed around a history that keeps getting richer. A view that shows a day or two today becomes a genuinely useful month or year comparison later, and I like visual history, so that compounding dataset is part of the product rather than just backend plumbing.
The $300 month
On 16 August I bought SuperGrok Heavy for $300. My invoice was $300 flat. At the time there was also a short lived promotion that included Cursor Ultra, normally $200 a month, at no extra charge. That matters because everything below about value for money leans on it, and as far as I can tell new Heavy subscribers do not get that bundle any more, so do not read this as current pricing advice.
Before that I had been on the $200 Claude Max tier, which cost me about $240 after UK VAT, and I had burned through the premium allowance I cared about in roughly two days. That says more about my habits than about the tier. My habit was simple. Strongest model, highest reasoning, and the strong model again for subagents. I was very good at spending scarce allowance quickly.
The Heavy month felt effectively unlimited in practice because I never once had to stop work for lack of inference. That changed how I behaved. I ran broad investigations, parallel agents and speculative branches I would never have started on a meter I was watching, including overnight runs where the alternative was an idle computer while I slept. For that particular month, with a new codebase and no map of the data sources, that was exactly what I wanted.
The measured Grok Build usage for 16 August through 14 September, from the exported usage data, looked like this.
| Token category | Measured tokens |
|---|---|
| Cache reads | 5,811,462,528 |
| Fresh input | 366,489,095 |
| Output | 35,543,841 |
| Total | 6,213,495,464 |
Cache reads were 93.53% of that total. At public list prices the same traffic priced at about $7,082.95, which is a pricing comparison and not a claim about what anything cost anyone to serve. Almost all of it was Grok 4.6. There was also a one day experiment on the old $30 plan that burned about 270.7M tokens in a day, 94% of it cached, but that is one observed workload, not an official quota for anything.
The included Cursor Ultra account became a second pool with its own mix.
| Cursor model and workload | Cache read | Cache write | Fresh input | Output | Approx total |
|---|---|---|---|---|---|
| Grok 4.6 Fast | 739.5M | n/a | 41.5M | 7.2M | 788.2M |
| Fable 5 High | 203.0M | 7.2M | 1.3M | 1.0M | 212.5M |
| Fable 5.1 Medium | 131.0M | 4.0M | 1,626 tokens | ~635K | ~135.64M |
| Opus 5 High | 18.1M | 0.9M | 280 tokens | 272K | ~19.27M |
Across Grok Build, Cursor Grok and the Anthropic models, the month's measured coding agent traffic was roughly 7.37 billion tokens, which priced at roughly $8.5K to $8.6K at the public list prices in force during the analysis, against the $300 I actually paid. Same caveat as before. That is nominal price arithmetic, not cash saved in any normal sense. One cross check I liked is that the two independent Grok harnesses converged on almost the same shape, about 93.5% cached reads on Grok Build and 93.8% on Cursor Grok. That is mostly what capable coding harnesses do with a large stable prefix, not cleverness on my part. The thing I actually got better at was deciding which model should do which job.
What the month bought
Breadth was the point, so the list is long. Routing and jump planning, Faction Warfare current and historical, live and public combat views, Global Combat, Alliance Combat Geography, market supply and market history, sovereignty with nineteen years of history, Creator Mode, and the collector and storage work underneath most of it. The through line is the collectors. Almost everything on that list either started recording history in August or is designed to get more useful as its history grows.
People started showing up sooner than I expected. My dashboard showed about 832 users between 18 August and 14 September, with 20 to 30 concurrent at the busier moments, though those are my own dated observations and traffic moves around. The nicer signal was Creator Mode escaping the builder bubble. Warlock Industries used it in a video, and the Reddit thread about it brought new players to a map that had been live for a matter of weeks. I had not expected real creators to be using the thing that fast.
The allocation lesson
Early in the month I still treated model quality as a single slider. Hard task, strongest model, highest effort, and if it needs subagents then more of the strongest model. By the end of the month the workflow had split by job. Broad implementation and orchestration went to Grok 4.6 at high effort. Abundant repo exploration, mechanical work and swarms of subagents went to the much cheaper Grok Fast pool. Fable went where its judgment paid for itself, mostly UI and product review, architecture and polish, and Fable 5.1 Medium often turned out to be enough, with High not automatically better enough to justify drinking from the scarcer pool.
The point that took me too long to see is that a fixed subscription is a resource allocation problem. Use the smartest model for everything can be a poor strategy even if that model really is smarter. It also means my old story about exhausting Claude Max in two days is not a fair prediction of what would happen if I went back now. I would use it completely differently.
How I found Muse
The Muse experiment was an accident. Near the end of the month I was looking through Cursor's Other Models pool because its allowance was about to reset, and I wanted to know which strong alternatives to Fable gave good performance for the money. Muse Spark 1.3 stood out, and then Meta's own Contributor pricing made the comparison look almost implausible. This is worth a table because I did not believe it either.
| Model | Context | Input / 1M | Cached input / 1M | Output / 1M | Data use |
|---|---|---|---|---|---|
| muse-spark-1.3-contributor | 1M | $0.10 | $0.002 | $0.20 | Used to improve Meta products |
| muse-spark-1.3 | 1M | $1.25 | $0.15 | $4.25 | Not used to improve Meta products |
Those were the prices on Meta's developer dashboard on 15 September, and prices move, so treat them as dated. The reason Contributor is that cheap is not magic and it should be said plainly. Meta says Contributor content can be used to improve its products. That trade is the whole price difference. I would not send secrets, keys, client material or anything genuinely sensitive through it, and neither should you. For a public hobby repository it was a trade I was comfortable making.
I started on the $5 Muse Code subscription, about £3.49 on my card, and upgraded to the $15 High plan partway through the first heavy run. The local harness is documented for macOS and Linux rather than native Windows, which sounded worse than it was. I ran it in WSL Ubuntu from VS Code, which needed a proper Linux Node setup and signing GitHub and Cloudflare in again inside WSL, and then it just worked. To be clear, the inference happens in Meta's cloud either way. WSL was only about the terminal harness, not about where the model runs.
The real test
I deliberately did not give Muse a toy benchmark. I gave it a real EO-Map feature with a real complaint attached. The Intel panel had useful public data but the pilot dossier was too dense for a first time user, all facts and no reading of them. The first brief asked for investigation, subagents, an improved Local list to pilot workflow that kept every honesty guarantee, tests, a self review, a pushed branch and a preview deploy. That pass genuinely improved the group result, but I thought the dossier still read too much like the production version, so I gave the same conversation a second, narrower pass: make the first viewport of a dossier understandable in a few seconds, without redesigning things just to make them look different.
The second pass did something I liked, which is that it resisted inventing a flashy new design. It put the all time window and the danger scale inline, connected the selected pilot back to the Watch reason that surfaced them, simplified the personal history line, made the existing map state more obvious, and moved the lower value geography and methodology one disclosure down while keeping all the research depth. Across the two accepted commits the diff was 22 files and +663 / -112, including tests and all seven locale files rather than just CSS. It ran the gates, used adversarial review children and fixed their blockers, pushed the branch and deployed working previews, which I smoked myself. Both commits later merged to main and shipped to production as part of the normal release.
One honest negative result. Muse tried to verify its work in a real browser and could not, because its sandbox blocked Chromium and Firefox from starting at all. To its credit it diagnosed that, disclosed it plainly instead of claiming the checks had run, and fell back to deterministic checks plus served artifact inspection. The visual gate stayed with me. If you are comparing harnesses, browser proof is one place where the setup genuinely mattered.
The receipts
The usage below comes from Muse's own native session logs, which I queried directly rather than trusting the subscription meter. This is the two implementation passes only.
| Metric | Measured result |
|---|---|
| Actual task wall clock | 2 h 49 m 31 s |
| Model calls | 587 |
| Tool calls | 813 |
| Spawned subagents | 10 |
| Workflow runs | 1 (its 5 children are included in the 10) |
| Fresh input | 1,751,169 |
| Cached input | 95,748,496 |
| Output | 344,158 |
| Reasoning | 158,472, subset of output |
| Total tokens | 97,843,823 |
The complete measured session through the second closeout, including an accounting detour I asked for in the middle, the harness's own reminder calls and one context compaction, was 625 model calls and 107,988,396 tokens, split 2,365,084 fresh, 105,239,472 cached and 383,840 output. I mention the accounting detour because an earlier draft of these numbers had a transcription slip in it, a million fresh tokens dropped from one cell, which I only caught because the subset stopped adding up to the superset. The figures here are the re-aggregated ones.
At the Contributor rates above, the two passes price at about $0.44 and the whole 108M token session at about $0.52. The same token mix repriced mechanically at the other two menus looked like this.
| Price list | Same-session cost | Multiple of Contributor |
|---|---|---|
| Contributor ($0.10 / $0.002 / $0.20) | $0.52 | 1x |
| Standard Muse ($1.25 / $0.15 / $4.25) | $20.37 | 38.9x |
| Opus 5 API rates used ($5 / $0.50 / $25) | $74.04 | 141x |
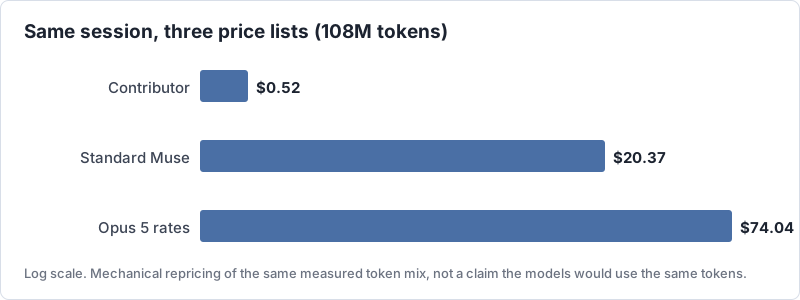
That Opus row needs its caveat stated twice because it is the row people will screenshot. It is workload specific price arithmetic at the Opus rates I used in the analysis, not a claim that Muse and Opus need the same tokens or produce the same work. I had also seen talk of Contributor being roughly 125 times cheaper than Opus in general, and I prefer my measured 141x on this workload with the caveat attached over a rounder number with none.
The subscription meter told a consistent story from the other side. During the first heavy run the $5 plan's rolling five hour meter hit about 89%, so I upgraded to High and watched it drop to about 30% on the same work, which is the expected threefold allowance. After both passes plus the accounting detour it sat at about 11% rolling and 3% weekly. That rolling figure is a usage allowance over a rolling window, not eleven percent of a stopwatch.
If you naively divide the 108M token session by that displayed 3% of a week, you get roughly 3.6 billion tokens a week, or about 15.6 billion in an average month, for this workload shape. That is more than double the 7.37 billion tokens I measured across the entire Heavy plus Cursor month. I want to be careful here because this is the easiest number in the post to misuse. It is an empirical linear extrapolation from one real session, not an official Meta quota, the dashboard percentage is rounded, and different task shapes may meter differently. And if Contributor ever goes away, do not assume the subscription quietly converts to fifteen billion normal priced tokens. Meta has never said quota meters in API dollars, and dividing by 38.9 to get 0.4 billion is arithmetic, not a forecast.
A note on the million token context
I deliberately kept both Muse passes in the same conversation, but that did not mean the harness carried a million tokens of prompt forever. The logs show one compaction shortly after the second task began. An internal soft threshold fired at around 384K input tokens and replaced most of the context with a roughly 23K summary. Caching rewarmed fast and was back above 95% within about five calls, and the largest single request I observed was 382,777 input tokens. Cache shares were about 99% lead and 94% children on the first pass and about 99% and 93% on the second, which is the same harness behaviour around stable prefixes I saw with Grok, not anything I did.
Is it any good
The quality judgment is the part I want to keep modest, because one UI task is useful evidence and not a universal ranking. Contributor at the top effort is clearly the real thing and not a cheap toy. It handled a large existing repo, contracts and docs, parallel children, tests, translations, git, reviews, fixes, preview deploys and later the production release, without me writing any code. For this UI and product task I would not yet put it level with Fable 5.1 on judgment and polish. Around Opus 5 level feels fair as a provisional description from this one test, and it lines up with independent impressions I had seen elsewhere, but that is an impression, not a benchmark result. Grok 4.6 at high effort remains good enough for a very large amount of implementation work, which is really the point. The discovery is not that everything should move to Muse. It is that a model can be good enough for a large class of jobs at wildly different economics. I plan to keep testing different models anyway, because independent model families are useful for reviews too. A different model has different blind spots.
What I actually learned
The Heavy month was useful because it removed inference anxiety during the exact period when EO-Map needed fast exploration. That bought a huge amount of repository and data source work, and it started collectors early enough that the history could compound. I do not think finding Muse afterwards makes that month a mistake. The month bought speed at the point where speed was worth the most.
The deeper lesson is that raw access to the strongest model was never the whole optimization problem. Harness quality, caching behaviour, subagent strategy, task shape and model allocation all matter, and a cheaper model that is good enough for implementation can be the better use of a fixed allowance while the expensive model waits for the small number of decisions where its judgment changes the result. Muse sharpened that lesson because its Contributor economics are so extreme. If the data use trade is acceptable for your repository, a task that priced in tens of dollars on other menus can price in cents. That may change, and no model is magically equivalent to every pricier one, but it lowers the cost of experimenting with agentic development to almost nothing.
None of this is an argument that software skill no longer matters, and it is definitely not a claim that AI wrote EO-Map. It is one hobby builder using agents as leverage, learning to allocate inference better, and discovering that the price and performance picture moved again while the project was only a month old. The right model for the job keeps changing, so the useful skill is building a workflow that can change with it. If any of the numbers above make you curious, or you think I have misread my own receipts somewhere, the map is at eo-map.com and the Intel panel from the experiment is at /intel/. Let me know.